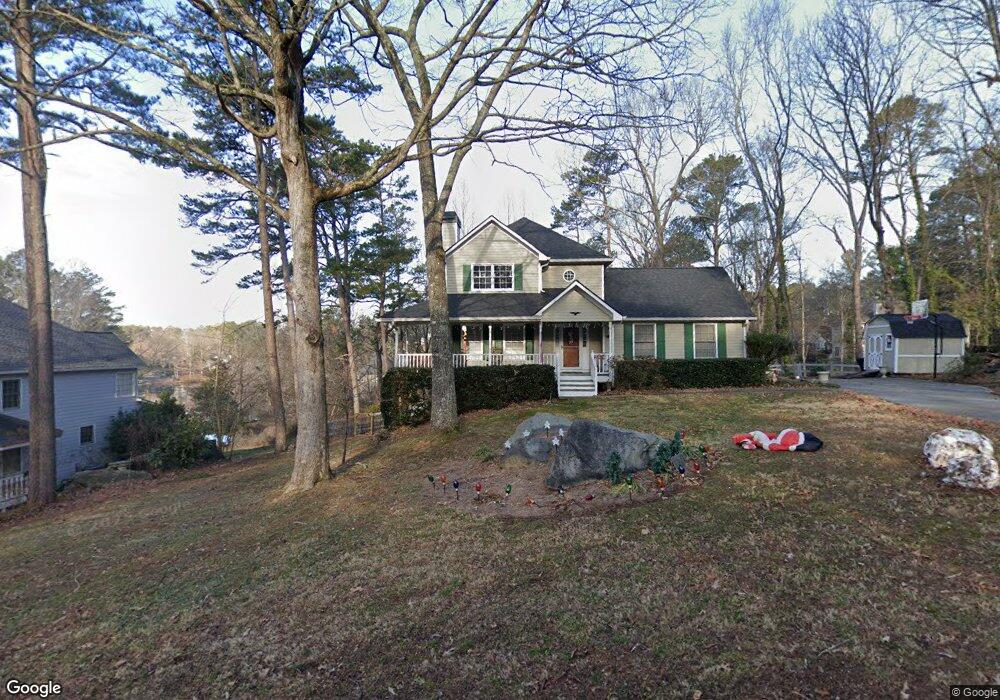
140 Picketts Forge Ln Unit VII Acworth, GA 30101
Cedarcrest NeighborhoodEstimated Value: $360,000 - $412,000
4
Beds
3
Baths
2,138
Sq Ft
$176/Sq Ft
Est. Value
About This Home
This home is located at 140 Picketts Forge Ln Unit VII, Acworth, GA 30101 and is currently estimated at $376,439, approximately $176 per square foot. 140 Picketts Forge Ln Unit VII is a home located in Paulding County with nearby schools including Roland W. Russom Elementary School, East Paulding Middle School, and North Paulding High School.
Ownership History
Date
Name
Owned For
Owner Type
Purchase Details
Closed on
Feb 15, 2008
Sold by
Davis Barbara A
Bought by
Riddle Brian C and Riddle Colleen R
Current Estimated Value
Home Financials for this Owner
Home Financials are based on the most recent Mortgage that was taken out on this home.
Original Mortgage
$161,910
Outstanding Balance
$101,001
Interest Rate
5.85%
Mortgage Type
New Conventional
Estimated Equity
$275,438
Purchase Details
Closed on
Jan 31, 2002
Sold by
Nice David G
Bought by
Davis Barbara A
Home Financials for this Owner
Home Financials are based on the most recent Mortgage that was taken out on this home.
Original Mortgage
$155,700
Interest Rate
7.07%
Mortgage Type
New Conventional
Create a Home Valuation Report for This Property
The Home Valuation Report is an in-depth analysis detailing your home's value as well as a comparison with similar homes in the area
Home Values in the Area
Average Home Value in this Area
Purchase History
| Date | Buyer | Sale Price | Title Company |
|---|---|---|---|
| Riddle Brian C | $179,900 | -- | |
| Davis Barbara A | $173,000 | -- |
Source: Public Records
Mortgage History
| Date | Status | Borrower | Loan Amount |
|---|---|---|---|
| Open | Riddle Brian C | $161,910 | |
| Previous Owner | Davis Barbara A | $155,700 |
Source: Public Records
Tax History Compared to Growth
Tax History
| Year | Tax Paid | Tax Assessment Tax Assessment Total Assessment is a certain percentage of the fair market value that is determined by local assessors to be the total taxable value of land and additions on the property. | Land | Improvement |
|---|---|---|---|---|
| 2024 | $3,126 | $128,904 | $14,000 | $114,904 |
| 2023 | $3,669 | $143,272 | $14,000 | $129,272 |
| 2022 | $3,204 | $124,772 | $14,000 | $110,772 |
| 2021 | $2,818 | $98,832 | $14,000 | $84,832 |
| 2020 | $2,584 | $88,856 | $14,000 | $74,856 |
| 2019 | $2,306 | $78,388 | $14,000 | $64,388 |
| 2018 | $2,359 | $80,172 | $14,000 | $66,172 |
| 2017 | $2,034 | $68,452 | $12,800 | $55,652 |
| 2016 | $1,934 | $65,836 | $12,800 | $53,036 |
| 2015 | $1,868 | $62,548 | $12,800 | $49,748 |
| 2014 | $1,852 | $60,516 | $12,800 | $47,716 |
| 2013 | -- | $53,560 | $12,800 | $40,760 |
Source: Public Records
Map
Nearby Homes
- 427 Picketts Lake Dr
- 3684 Autumn View Dr NW
- 3465 Plantation Ridge NW
- 254 Broadstone Blvd
- 39 Telfair Ct
- 64 Telfair Ct
- 138 Highcrest Dr
- 176 Nightwind Trace
- 261 Highcrest Dr
- 84 Cedarcrest Village Ln
- 76 Ashdowne Way
- 28 Vandiver Ct
- 71 Vandiver Ct
- 64 Cedarcrest Village Ct
- 118 Cedarcrest Village Ct
- 416 Fairway Dr
- 16 Hawkstone Ct
- 172 Picketts Forge Ln
- 114 Picketts Forge Ln
- 0 Picketts Forge Ln Unit 8225840
- 47 Musket Way
- 147 Picketts Forge Ln Unit VII
- 165 Picketts Forge Ln
- 123 Picketts Forge Ln Unit 114
- 123 Picketts Forge Ln
- 188 Picketts Forge Ln Unit 7
- 80 Picketts Forge Ln
- 183 Picketts Forge Ln Unit 7
- 183 Picketts Forge Ln Unit 111
- 73 Musket Way
- 204 Picketts Forge Ln
- 75 Picketts Forge Ln
- 24 Musket Way
- 191 Picketts Forge Ln
- 66 Musket Way
- 78 Musket Way
- 70 Musket Way Unit VII