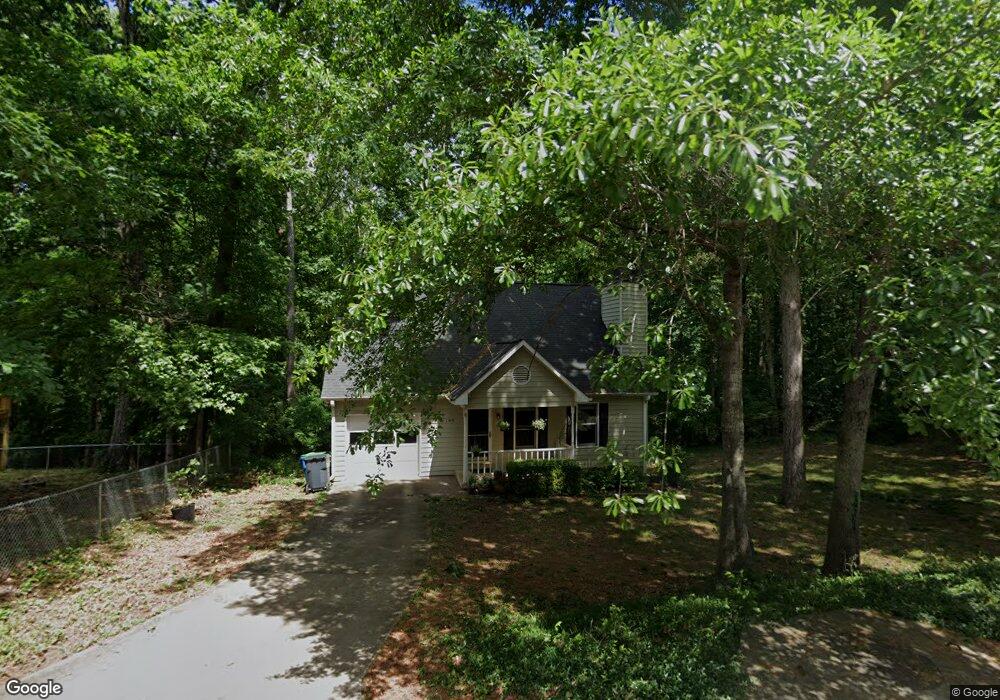
140 Rachel Way Athens, GA 30605
Estimated Value: $288,000 - $326,000
3
Beds
2
Baths
1,469
Sq Ft
$207/Sq Ft
Est. Value
About This Home
This home is located at 140 Rachel Way, Athens, GA 30605 and is currently estimated at $303,804, approximately $206 per square foot. 140 Rachel Way is a home located in Clarke County with nearby schools including Barnett Shoals Elementary School, Hilsman Middle School, and Cedar Shoals High School.
Ownership History
Date
Name
Owned For
Owner Type
Purchase Details
Closed on
Jul 28, 2006
Sold by
Not Provided
Bought by
Kittleson Julie M
Current Estimated Value
Home Financials for this Owner
Home Financials are based on the most recent Mortgage that was taken out on this home.
Original Mortgage
$110,400
Outstanding Balance
$65,522
Interest Rate
6.74%
Mortgage Type
New Conventional
Estimated Equity
$238,282
Purchase Details
Closed on
Jun 23, 2005
Sold by
Ashe Russell and Ashe Amy Ashe
Bought by
Ashe Amy T
Purchase Details
Closed on
Aug 26, 2002
Sold by
Dream Builders Inc
Bought by
Ashe Russell and Amy Ashe
Purchase Details
Closed on
Feb 6, 2002
Sold by
Morrell James C and Morrell Christy B
Bought by
Dream Builders Inc
Purchase Details
Closed on
Jan 27, 1995
Sold by
Buckston Properties Ltd
Bought by
Morrell James C and Morrell Christy B
Create a Home Valuation Report for This Property
The Home Valuation Report is an in-depth analysis detailing your home's value as well as a comparison with similar homes in the area
Home Values in the Area
Average Home Value in this Area
Purchase History
| Date | Buyer | Sale Price | Title Company |
|---|---|---|---|
| Kittleson Julie M | $138,000 | -- | |
| Ashe Amy T | -- | -- | |
| Ashe Russell | $129,600 | -- | |
| Dream Builders Inc | $125,000 | -- | |
| Morrell James C | $79,200 | -- |
Source: Public Records
Mortgage History
| Date | Status | Borrower | Loan Amount |
|---|---|---|---|
| Open | Kittleson Julie M | $110,400 | |
| Closed | Kittleson Julie M | $27,600 |
Source: Public Records
Tax History Compared to Growth
Tax History
| Year | Tax Paid | Tax Assessment Tax Assessment Total Assessment is a certain percentage of the fair market value that is determined by local assessors to be the total taxable value of land and additions on the property. | Land | Improvement |
|---|---|---|---|---|
| 2025 | $2,624 | $102,706 | $12,000 | $90,706 |
| 2024 | $2,624 | $96,923 | $12,000 | $84,923 |
| 2023 | $1,754 | $91,128 | $12,000 | $79,128 |
| 2022 | $2,244 | $80,358 | $10,400 | $69,958 |
| 2021 | $1,868 | $65,426 | $10,400 | $55,026 |
| 2020 | $1,757 | $62,127 | $10,400 | $51,727 |
| 2019 | $1,528 | $55,001 | $10,400 | $44,601 |
| 2018 | $1,391 | $50,968 | $10,400 | $40,568 |
| 2017 | $1,153 | $43,968 | $10,400 | $33,568 |
| 2016 | $993 | $39,247 | $10,400 | $28,847 |
| 2015 | $979 | $38,777 | $10,400 | $28,377 |
| 2014 | $1,000 | $39,344 | $10,400 | $28,944 |
Source: Public Records
Map
Nearby Homes