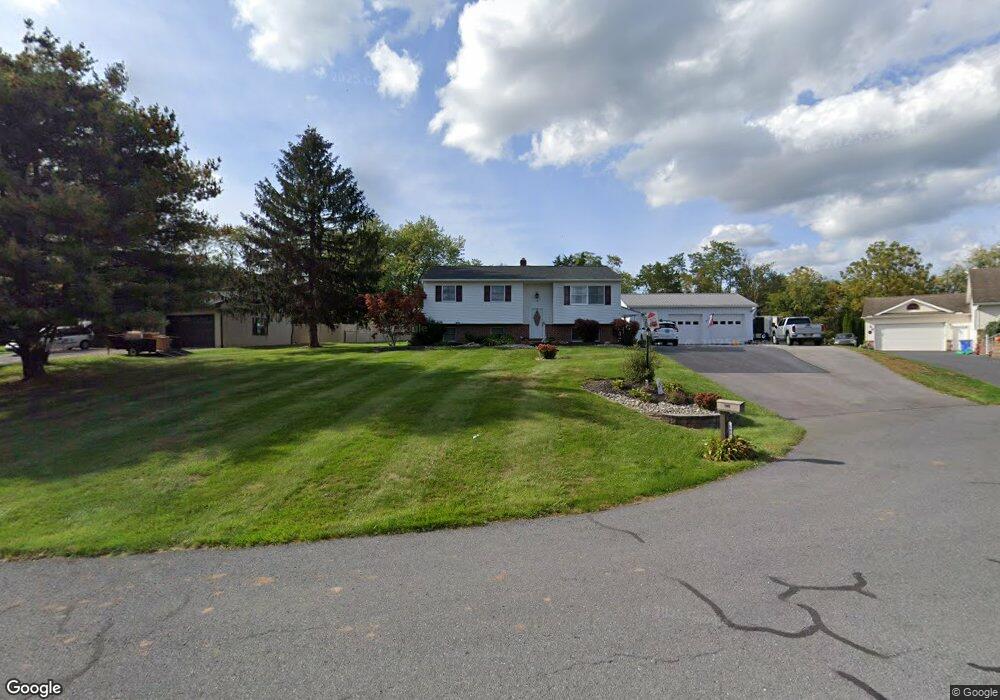
140 Redstone Dr York Haven, PA 17370
Estimated Value: $291,000 - $358,000
4
Beds
2
Baths
1,628
Sq Ft
$193/Sq Ft
Est. Value
About This Home
This home is located at 140 Redstone Dr, York Haven, PA 17370 and is currently estimated at $314,761, approximately $193 per square foot. 140 Redstone Dr is a home located in York County with nearby schools including Newberry Elementary School, Allen Middle School, and Red Land Senior High School.
Ownership History
Date
Name
Owned For
Owner Type
Purchase Details
Closed on
Dec 14, 2009
Sold by
Malitsch Tami
Bought by
Stauffer Brian
Current Estimated Value
Home Financials for this Owner
Home Financials are based on the most recent Mortgage that was taken out on this home.
Original Mortgage
$188,774
Outstanding Balance
$123,760
Interest Rate
5%
Mortgage Type
New Conventional
Estimated Equity
$191,001
Purchase Details
Closed on
Apr 17, 2009
Sold by
Bower Owen O and Bower Roberta R
Bought by
Malitsch Tami
Home Financials for this Owner
Home Financials are based on the most recent Mortgage that was taken out on this home.
Original Mortgage
$176,739
Interest Rate
4.93%
Mortgage Type
FHA
Purchase Details
Closed on
Aug 20, 1999
Sold by
Mowrey William M and Mowrey Linda D
Bought by
Bower Owen O and Bower Roberta R
Home Financials for this Owner
Home Financials are based on the most recent Mortgage that was taken out on this home.
Original Mortgage
$123,600
Interest Rate
7.5%
Mortgage Type
VA
Create a Home Valuation Report for This Property
The Home Valuation Report is an in-depth analysis detailing your home's value as well as a comparison with similar homes in the area
Home Values in the Area
Average Home Value in this Area
Purchase History
| Date | Buyer | Sale Price | Title Company |
|---|---|---|---|
| Stauffer Brian | $185,000 | Chicago Title Insurance Co | |
| Malitsch Tami | $180,000 | Chicago Title Insurance Co | |
| Bower Owen O | $120,000 | -- |
Source: Public Records
Mortgage History
| Date | Status | Borrower | Loan Amount |
|---|---|---|---|
| Open | Stauffer Brian | $188,774 | |
| Previous Owner | Malitsch Tami | $176,739 | |
| Previous Owner | Bower Owen O | $123,600 |
Source: Public Records
Tax History
| Year | Tax Paid | Tax Assessment Tax Assessment Total Assessment is a certain percentage of the fair market value that is determined by local assessors to be the total taxable value of land and additions on the property. | Land | Improvement |
|---|---|---|---|---|
| 2025 | $3,549 | $128,120 | $44,360 | $83,760 |
| 2024 | $4,639 | $128,120 | $44,360 | $83,760 |
| 2023 | $3,173 | $128,120 | $44,360 | $83,760 |
| 2022 | $3,163 | $128,120 | $44,360 | $83,760 |
| 2021 | $2,981 | $128,120 | $44,360 | $83,760 |
| 2020 | $2,946 | $128,120 | $44,360 | $83,760 |
| 2019 | $2,870 | $128,120 | $44,360 | $83,760 |
| 2018 | $2,847 | $128,120 | $44,360 | $83,760 |
| 2017 | $2,771 | $128,120 | $44,360 | $83,760 |
| 2016 | $0 | $128,120 | $44,360 | $83,760 |
| 2015 | -- | $128,120 | $44,360 | $83,760 |
| 2014 | -- | $128,120 | $44,360 | $83,760 |
Source: Public Records
Map
Nearby Homes
- 85 Redstone Dr
- 0 Lewisberry Rd
- 0 Lewisberry Rd
- 470 York Rd
- 800 Garriston Rd
- 300 Ridge Rd Unit 99
- 800 York Rd
- 95 Village Rd
- 2115 Potts Hill Rd
- 0 Potts Hill Rd - Lot 2 (D-2)
- 719 Pleasant View Rd
- 833 Stonybrook Ln
- 935 Silver Lake Rd
- 707 Wyndamere Rd
- 121 Scully Place
- 40 Alfred Dr Unit 24
- 118 Scully Place
- 109 Scully Place
- Lot 0 Vista Cir
- 85 Vista Cir
- 130 Redstone Dr
- 150 Redstone Dr
- 155 Redstone Dr
- 120 Redstone Dr
- 125 Redstone Dr
- 145 Redstone Dr
- 115 Redstone Dr
- 100 Redstone Dr
- 105 Redstone Dr
- 120 Stricker Dr
- 90 Redstone Dr
- 130 Stricker Dr
- 110 Stricker Dr
- 100 Stricker Dr
- 140 Stricker Dr
- 293 Garriston Rd
- 95 Stricker Dr
- 95 Stricker Dr
- 295 Garriston Rd
- 289 Holiday Dr
Your Personal Tour Guide
Ask me questions while you tour the home.