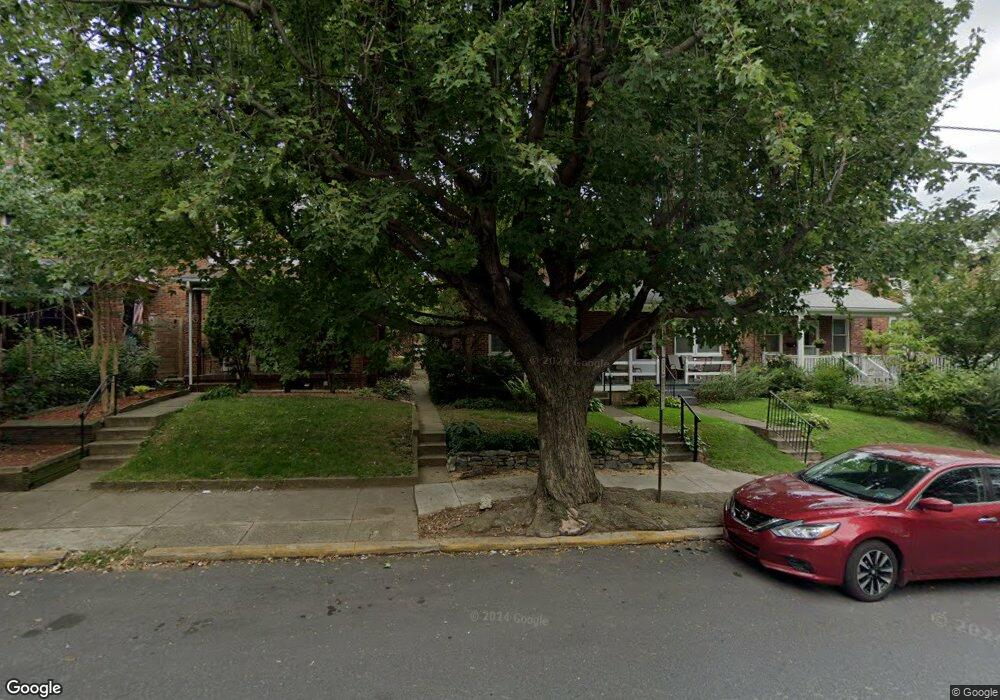
140 Ruby St Lancaster, PA 17603
West End NeighborhoodEstimated Value: $213,455 - $246,000
3
Beds
1
Bath
1,140
Sq Ft
$203/Sq Ft
Est. Value
About This Home
This home is located at 140 Ruby St, Lancaster, PA 17603 and is currently estimated at $230,864, approximately $202 per square foot. 140 Ruby St is a home located in Lancaster County with nearby schools including Smith-Wade-El Elementary School, Wheatland Middle School, and McCaskey High School.
Ownership History
Date
Name
Owned For
Owner Type
Purchase Details
Closed on
Jan 28, 1999
Sold by
Gunselman Dion F and Gunselman Ann Marie
Bought by
Martin Torrie L
Current Estimated Value
Home Financials for this Owner
Home Financials are based on the most recent Mortgage that was taken out on this home.
Original Mortgage
$67,900
Outstanding Balance
$15,975
Interest Rate
6.67%
Estimated Equity
$214,889
Create a Home Valuation Report for This Property
The Home Valuation Report is an in-depth analysis detailing your home's value as well as a comparison with similar homes in the area
Home Values in the Area
Average Home Value in this Area
Purchase History
| Date | Buyer | Sale Price | Title Company |
|---|---|---|---|
| Martin Torrie L | $71,500 | Fidelity National Title |
Source: Public Records
Mortgage History
| Date | Status | Borrower | Loan Amount |
|---|---|---|---|
| Open | Martin Torrie L | $67,900 |
Source: Public Records
Tax History
| Year | Tax Paid | Tax Assessment Tax Assessment Total Assessment is a certain percentage of the fair market value that is determined by local assessors to be the total taxable value of land and additions on the property. | Land | Improvement |
|---|---|---|---|---|
| 2025 | $3,166 | $80,000 | $23,300 | $56,700 |
| 2024 | $3,166 | $80,000 | $23,300 | $56,700 |
| 2023 | $3,112 | $80,000 | $23,300 | $56,700 |
| 2022 | $2,983 | $80,000 | $23,300 | $56,700 |
| 2021 | $2,919 | $80,000 | $23,300 | $56,700 |
| 2020 | $2,919 | $80,000 | $23,300 | $56,700 |
| 2019 | $2,875 | $80,000 | $23,300 | $56,700 |
| 2018 | $1,269 | $80,000 | $23,300 | $56,700 |
| 2017 | $3,518 | $76,600 | $27,000 | $49,600 |
| 2016 | $3,486 | $76,600 | $27,000 | $49,600 |
| 2015 | $1,360 | $76,600 | $27,000 | $49,600 |
| 2014 | $2,615 | $76,600 | $27,000 | $49,600 |
Source: Public Records
Map
Nearby Homes
Your Personal Tour Guide
Ask me questions while you tour the home.