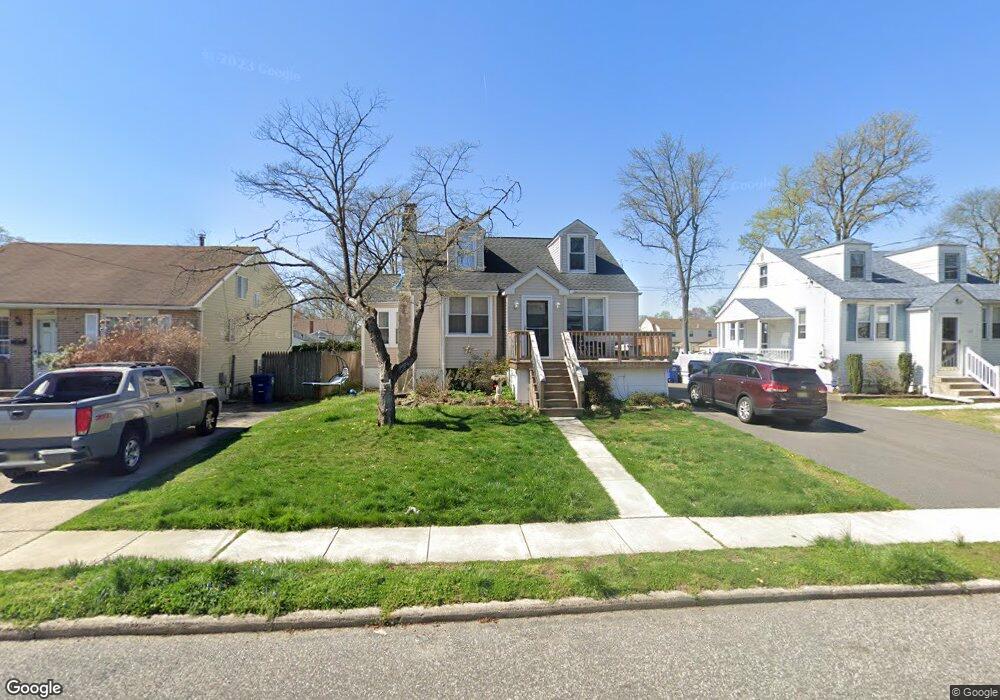
140 S Maple Ave Maple Shade, NJ 08052
Estimated Value: $306,000 - $380,000
--
Bed
--
Bath
1,460
Sq Ft
$231/Sq Ft
Est. Value
About This Home
This home is located at 140 S Maple Ave, Maple Shade, NJ 08052 and is currently estimated at $337,974, approximately $231 per square foot. 140 S Maple Ave is a home located in Burlington County with nearby schools including Ralph J Steinhauer Elementary School, Maude M. Wilkins Elementary School, and Howard R Yocum School.
Ownership History
Date
Name
Owned For
Owner Type
Purchase Details
Closed on
Apr 27, 2007
Sold by
Weaks Leslie V and Weaks Amy B
Bought by
Morrow Sean and Morrow Suzanne L
Current Estimated Value
Home Financials for this Owner
Home Financials are based on the most recent Mortgage that was taken out on this home.
Original Mortgage
$226,345
Outstanding Balance
$138,428
Interest Rate
6.27%
Mortgage Type
FHA
Estimated Equity
$199,546
Purchase Details
Closed on
Dec 20, 2002
Sold by
Pollock Donald L
Bought by
Weaks Leslie and Weaks Amy B
Home Financials for this Owner
Home Financials are based on the most recent Mortgage that was taken out on this home.
Original Mortgage
$139,900
Interest Rate
6.19%
Purchase Details
Closed on
Nov 1, 2002
Sold by
Tracy Patricia E and Nolle Patricia E
Bought by
Pollock Donald I
Home Financials for this Owner
Home Financials are based on the most recent Mortgage that was taken out on this home.
Original Mortgage
$139,900
Interest Rate
6.19%
Create a Home Valuation Report for This Property
The Home Valuation Report is an in-depth analysis detailing your home's value as well as a comparison with similar homes in the area
Home Values in the Area
Average Home Value in this Area
Purchase History
| Date | Buyer | Sale Price | Title Company |
|---|---|---|---|
| Morrow Sean | $229,000 | Affiliated Title Of South Je | |
| Weaks Leslie | $139,900 | Congress Title Corp | |
| Pollock Donald I | $77,000 | Congress Title Corp |
Source: Public Records
Mortgage History
| Date | Status | Borrower | Loan Amount |
|---|---|---|---|
| Open | Morrow Sean | $226,345 | |
| Previous Owner | Weaks Leslie | $139,900 |
Source: Public Records
Tax History Compared to Growth
Tax History
| Year | Tax Paid | Tax Assessment Tax Assessment Total Assessment is a certain percentage of the fair market value that is determined by local assessors to be the total taxable value of land and additions on the property. | Land | Improvement |
|---|---|---|---|---|
| 2025 | $6,723 | $177,100 | $46,600 | $130,500 |
| 2024 | $6,528 | $177,100 | $46,600 | $130,500 |
| 2023 | $6,528 | $177,100 | $46,600 | $130,500 |
| 2022 | $6,427 | $177,100 | $46,600 | $130,500 |
| 2021 | $6,365 | $177,100 | $46,600 | $130,500 |
| 2020 | $6,383 | $177,100 | $46,600 | $130,500 |
| 2019 | $6,149 | $177,100 | $46,600 | $130,500 |
| 2018 | $6,043 | $177,100 | $46,600 | $130,500 |
| 2017 | $5,972 | $177,100 | $46,600 | $130,500 |
| 2016 | $5,883 | $177,100 | $46,600 | $130,500 |
| 2015 | $5,756 | $177,100 | $46,600 | $130,500 |
| 2014 | $5,580 | $177,100 | $46,600 | $130,500 |
Source: Public Records
Map
Nearby Homes
- 112 S Maple Ave
- 120 E Center Ave
- 52 S Fellowship Rd
- 19 S Chestnut Ave
- 410 S Forklanding Rd
- 26 N Poplar Ave
- 22 Theodore Ave
- 44 S Pine Ave
- 57 S Terrace Ave
- 202 S Cedar Ave
- 104 E Laurelton Ave
- 15 S Pine Ave
- 702 E Main St
- 29 W Broadway
- 621 S Forklanding Rd
- 2 Gainor Ave
- 319 S Coles Ave
- 327 S Coles Ave
- 306 E Rudderow Ave
- 411 Stiles Ave Unit E-5
- 136 S Maple Ave
- 148 S Maple Ave
- 211 E Center Ave
- 132 S Maple Ave
- 207 E Center Ave
- 128 S Maple Ave
- 241 Elm Ave
- 147 S Maple Ave
- 239 Elm Ave
- 149 S Maple Ave
- 202 S Maple Ave
- 233 Elm Ave
- 143 S Maple Ave
- 247 Elm Ave
- 139 S Maple Ave
- 124 S Maple Ave
- 135 S Maple Ave
- 206 S Maple Ave
- 313 E Center Ave
- 227 Elm Ave