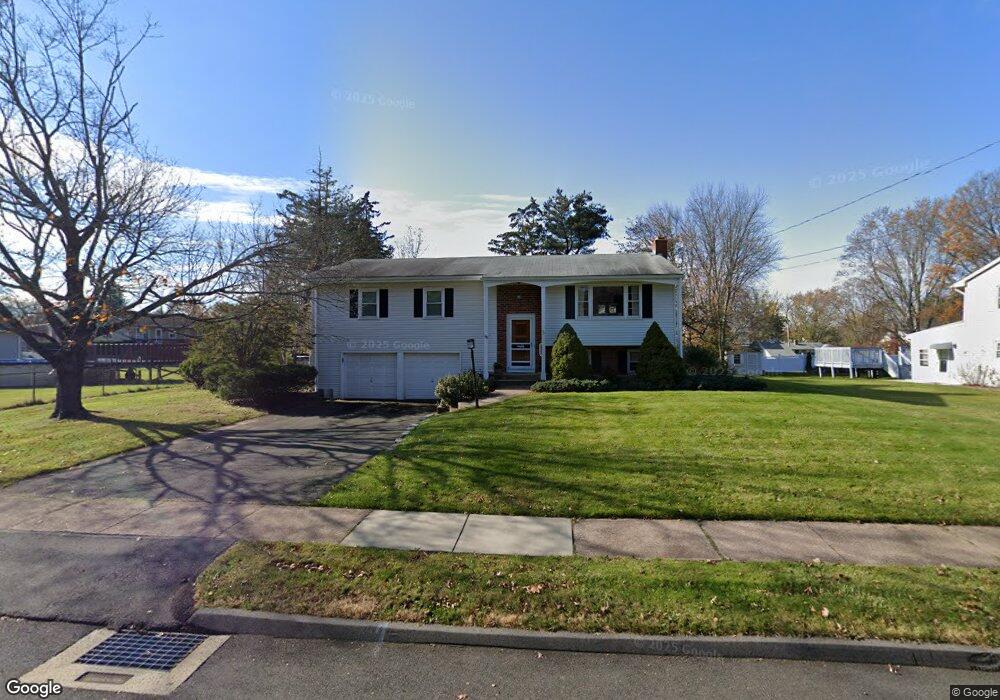
140 Sawka Dr East Hartford, CT 06118
Estimated Value: $360,000 - $389,000
3
Beds
3
Baths
1,282
Sq Ft
$293/Sq Ft
Est. Value
About This Home
This home is located at 140 Sawka Dr, East Hartford, CT 06118 and is currently estimated at $375,316, approximately $292 per square foot. 140 Sawka Dr is a home located in Hartford County with nearby schools including Governor William Pitkin School, East Hartford Middle School, and East Hartford High School.
Ownership History
Date
Name
Owned For
Owner Type
Purchase Details
Closed on
Apr 17, 2012
Sold by
Pease Douglas M
Bought by
Duncan Linda K
Current Estimated Value
Home Financials for this Owner
Home Financials are based on the most recent Mortgage that was taken out on this home.
Original Mortgage
$60,000
Outstanding Balance
$41,443
Interest Rate
3.91%
Estimated Equity
$333,873
Purchase Details
Closed on
Aug 31, 1999
Sold by
Espinola Martin V and Espinola Diane D
Bought by
Duncan Linda K and Pease Douglas M
Home Financials for this Owner
Home Financials are based on the most recent Mortgage that was taken out on this home.
Original Mortgage
$120,900
Interest Rate
7.53%
Purchase Details
Closed on
Mar 27, 1998
Sold by
Sales 2000 Inc
Bought by
Lilly Victor S
Purchase Details
Closed on
Jan 13, 1998
Sold by
Fhlmc
Bought by
Sales 2000 Inc
Purchase Details
Closed on
Dec 17, 1990
Sold by
Kay Travis J
Bought by
Espinola Martin
Create a Home Valuation Report for This Property
The Home Valuation Report is an in-depth analysis detailing your home's value as well as a comparison with similar homes in the area
Home Values in the Area
Average Home Value in this Area
Purchase History
| Date | Buyer | Sale Price | Title Company |
|---|---|---|---|
| Duncan Linda K | -- | -- | |
| Duncan Linda K | $151,125 | -- | |
| Lilly Victor S | $113,000 | -- | |
| Sales 2000 Inc | $52,000 | -- | |
| Espinola Martin | $180,000 | -- |
Source: Public Records
Mortgage History
| Date | Status | Borrower | Loan Amount |
|---|---|---|---|
| Open | Espinola Martin | $60,000 | |
| Previous Owner | Espinola Martin | $102,521 | |
| Previous Owner | Espinola Martin | $120,900 |
Source: Public Records
Tax History Compared to Growth
Tax History
| Year | Tax Paid | Tax Assessment Tax Assessment Total Assessment is a certain percentage of the fair market value that is determined by local assessors to be the total taxable value of land and additions on the property. | Land | Improvement |
|---|---|---|---|---|
| 2025 | $7,627 | $166,160 | $45,930 | $120,230 |
| 2024 | $7,311 | $166,160 | $45,930 | $120,230 |
| 2023 | $7,068 | $166,160 | $45,930 | $120,230 |
| 2022 | $6,813 | $166,160 | $45,930 | $120,230 |
| 2021 | $6,237 | $126,390 | $34,800 | $91,590 |
| 2020 | $6,309 | $126,390 | $34,800 | $91,590 |
| 2019 | $6,207 | $126,390 | $34,800 | $91,590 |
| 2018 | $6,024 | $126,390 | $34,800 | $91,590 |
| 2017 | $5,947 | $126,390 | $34,800 | $91,590 |
| 2016 | $5,939 | $129,500 | $36,540 | $92,960 |
| 2015 | $5,939 | $129,500 | $36,540 | $92,960 |
| 2014 | $5,879 | $129,500 | $36,540 | $92,960 |
Source: Public Records
Map
Nearby Homes
- 127 Ridgewood Rd
- 334 Forbes St
- 113 Woodlawn Cir
- 6 Judy Dr
- 0 Deborah Dr Unit 115
- 0 Deborah Dr Unit 117 24077631
- 49 Deborah Dr Unit 123
- 218 Wakefield Cir Unit 218
- 122 Janet Dr
- 95 Arnold Dr
- 207 Arnold Dr
- 73 Walnut St
- 8 Howard Ct Unit 10
- 4 Gladys Rd
- 40 Larrabee St
- 143R Oak St
- 90 Christine Dr
- 21 Forest Ln
- 26 Casabella Cir Unit 28
- 15 Christine Dr