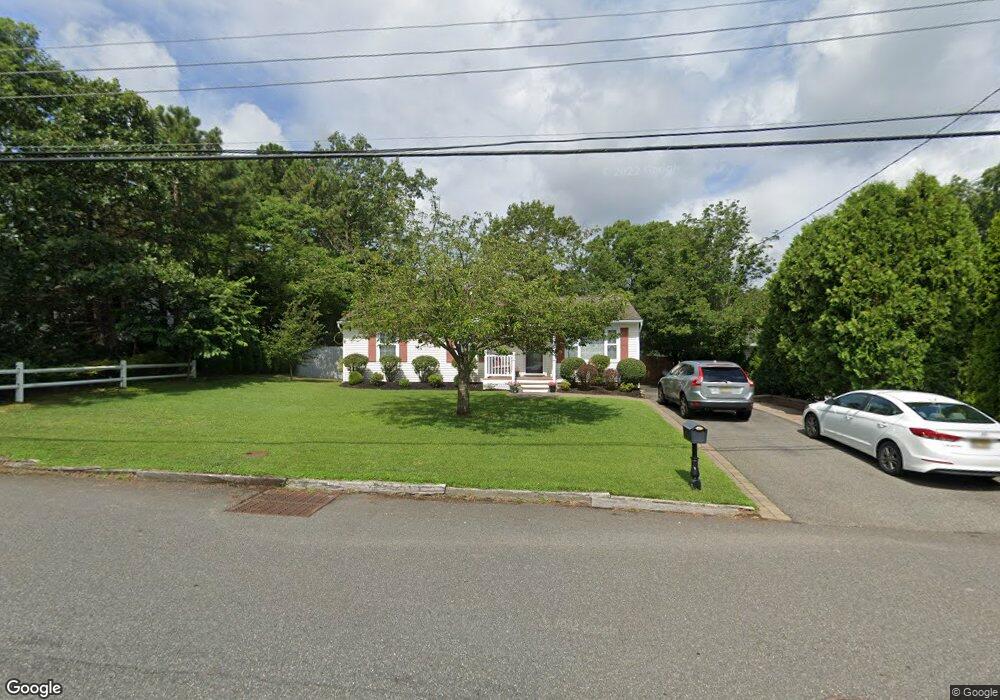
140 Sloop Rd Manahawkin, NJ 08050
Estimated Value: $346,000 - $456,000
3
Beds
1
Bath
1,276
Sq Ft
$316/Sq Ft
Est. Value
About This Home
This home is located at 140 Sloop Rd, Manahawkin, NJ 08050 and is currently estimated at $402,651, approximately $315 per square foot. 140 Sloop Rd is a home located in Ocean County with nearby schools including Ocean Acres Elementary School, Oxycocus Elementary School, and McKinley Avenue Elementary School.
Ownership History
Date
Name
Owned For
Owner Type
Purchase Details
Closed on
Nov 16, 2000
Sold by
First Union National Bank
Bought by
Colino Salvatore
Current Estimated Value
Home Financials for this Owner
Home Financials are based on the most recent Mortgage that was taken out on this home.
Original Mortgage
$87,297
Outstanding Balance
$31,754
Interest Rate
7.7%
Mortgage Type
FHA
Estimated Equity
$370,897
Create a Home Valuation Report for This Property
The Home Valuation Report is an in-depth analysis detailing your home's value as well as a comparison with similar homes in the area
Home Values in the Area
Average Home Value in this Area
Purchase History
| Date | Buyer | Sale Price | Title Company |
|---|---|---|---|
| Colino Salvatore | $88,000 | -- | |
| Colino Salvatore | $88,000 | -- |
Source: Public Records
Mortgage History
| Date | Status | Borrower | Loan Amount |
|---|---|---|---|
| Open | Colino Salvatore | $87,297 | |
| Closed | Colino Salvatore | $87,297 |
Source: Public Records
Tax History
| Year | Tax Paid | Tax Assessment Tax Assessment Total Assessment is a certain percentage of the fair market value that is determined by local assessors to be the total taxable value of land and additions on the property. | Land | Improvement |
|---|---|---|---|---|
| 2025 | $4,191 | $168,800 | $62,000 | $106,800 |
| 2024 | $4,151 | $168,800 | $62,000 | $106,800 |
| 2023 | $3,974 | $168,800 | $62,000 | $106,800 |
| 2022 | $3,974 | $168,800 | $62,000 | $106,800 |
| 2021 | $3,920 | $168,800 | $62,000 | $106,800 |
| 2020 | $3,925 | $168,800 | $62,000 | $106,800 |
| 2019 | $3,869 | $168,800 | $62,000 | $106,800 |
| 2018 | $3,845 | $168,800 | $62,000 | $106,800 |
| 2017 | $3,802 | $161,600 | $62,000 | $99,600 |
| 2016 | $3,764 | $161,600 | $62,000 | $99,600 |
| 2015 | $3,631 | $161,600 | $62,000 | $99,600 |
| 2014 | $3,579 | $157,300 | $61,200 | $96,100 |
Source: Public Records
Map
Nearby Homes
Your Personal Tour Guide
Ask me questions while you tour the home.