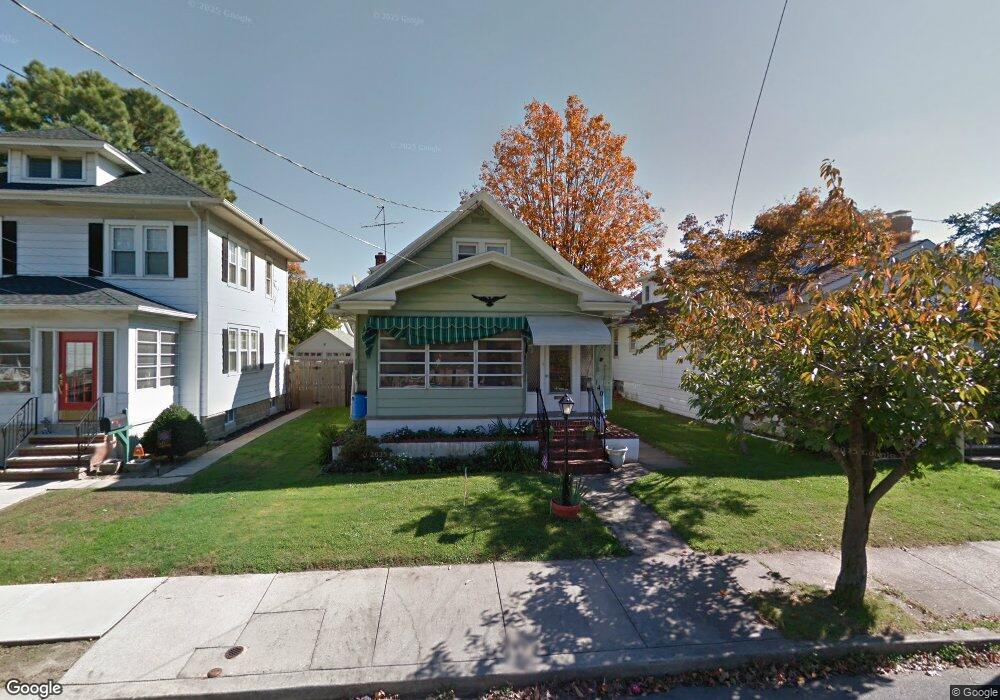
140 Spring St Woodbury, NJ 08096
Estimated Value: $206,950 - $303,000
--
Bed
--
Bath
1,234
Sq Ft
$213/Sq Ft
Est. Value
About This Home
This home is located at 140 Spring St, Woodbury, NJ 08096 and is currently estimated at $262,988, approximately $213 per square foot. 140 Spring St is a home located in Gloucester County with nearby schools including Woodbury Junior/Senior High School and Holy Angels Catholic School.
Ownership History
Date
Name
Owned For
Owner Type
Purchase Details
Closed on
Sep 27, 1999
Sold by
Russo Robert J
Bought by
Jones Bryan D and Jones Stephanie L
Current Estimated Value
Home Financials for this Owner
Home Financials are based on the most recent Mortgage that was taken out on this home.
Original Mortgage
$81,225
Outstanding Balance
$24,488
Interest Rate
7.81%
Estimated Equity
$238,500
Purchase Details
Closed on
Jan 28, 1999
Sold by
Strang Violet K
Bought by
Russo Robert J
Home Financials for this Owner
Home Financials are based on the most recent Mortgage that was taken out on this home.
Original Mortgage
$35,000
Interest Rate
6.67%
Mortgage Type
Stand Alone First
Create a Home Valuation Report for This Property
The Home Valuation Report is an in-depth analysis detailing your home's value as well as a comparison with similar homes in the area
Home Values in the Area
Average Home Value in this Area
Purchase History
| Date | Buyer | Sale Price | Title Company |
|---|---|---|---|
| Jones Bryan D | $85,500 | -- | |
| Russo Robert J | $83,500 | -- |
Source: Public Records
Mortgage History
| Date | Status | Borrower | Loan Amount |
|---|---|---|---|
| Open | Jones Bryan D | $81,225 | |
| Previous Owner | Russo Robert J | $35,000 |
Source: Public Records
Tax History Compared to Growth
Tax History
| Year | Tax Paid | Tax Assessment Tax Assessment Total Assessment is a certain percentage of the fair market value that is determined by local assessors to be the total taxable value of land and additions on the property. | Land | Improvement |
|---|---|---|---|---|
| 2025 | $5,985 | $124,400 | $35,000 | $89,400 |
| 2024 | $5,772 | $124,400 | $35,000 | $89,400 |
| 2023 | $5,772 | $124,400 | $35,000 | $89,400 |
| 2022 | $5,670 | $124,400 | $35,000 | $89,400 |
| 2021 | $5,596 | $124,400 | $35,000 | $89,400 |
| 2020 | $5,363 | $108,600 | $35,000 | $73,600 |
| 2019 | $5,182 | $108,600 | $35,000 | $73,600 |
| 2018 | $5,067 | $108,600 | $35,000 | $73,600 |
| 2017 | $4,981 | $108,600 | $35,000 | $73,600 |
| 2016 | $4,912 | $108,600 | $35,000 | $73,600 |
| 2015 | $4,832 | $108,600 | $35,000 | $73,600 |
| 2014 | $4,756 | $108,600 | $35,000 | $73,600 |
Source: Public Records
Map
Nearby Homes