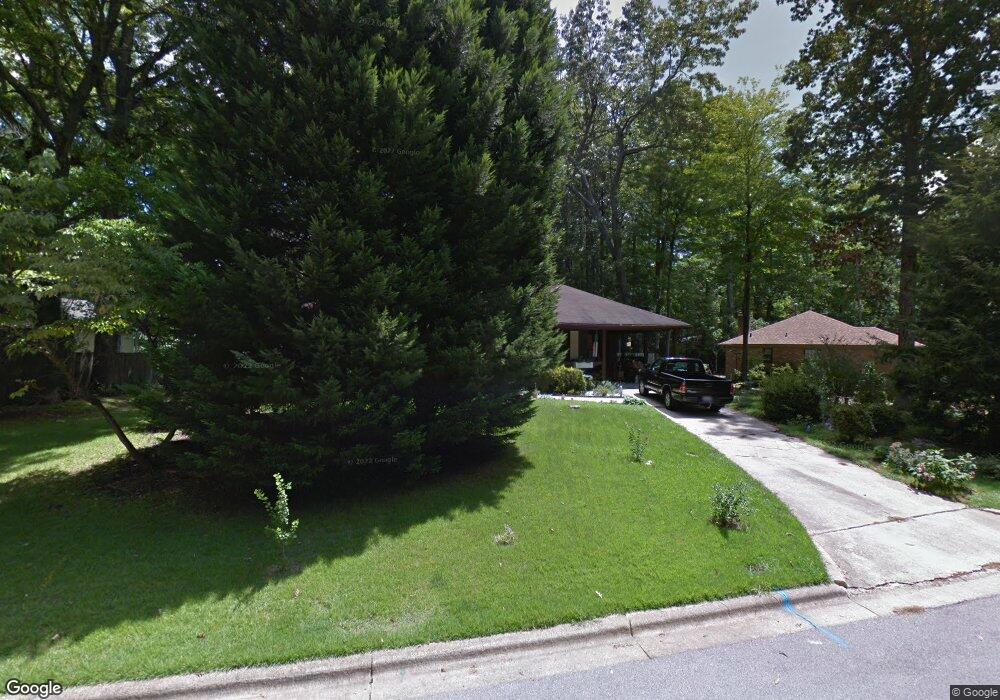
140 Sycamore St Cary, NC 27513
South Cary NeighborhoodEstimated Value: $332,000 - $440,926
3
Beds
2
Baths
1,318
Sq Ft
$309/Sq Ft
Est. Value
About This Home
This home is located at 140 Sycamore St, Cary, NC 27513 and is currently estimated at $407,482, approximately $309 per square foot. 140 Sycamore St is a home located in Wake County with nearby schools including Weatherstone Elementary School, East Cary Middle School, and Cary High School.
Ownership History
Date
Name
Owned For
Owner Type
Purchase Details
Closed on
May 26, 2023
Sold by
Provostand Martin Holdings Llc
Bought by
Provost Jonathan M and Provost Catherine M
Current Estimated Value
Home Financials for this Owner
Home Financials are based on the most recent Mortgage that was taken out on this home.
Original Mortgage
$190,000
Outstanding Balance
$184,807
Interest Rate
6.27%
Mortgage Type
New Conventional
Estimated Equity
$222,675
Purchase Details
Closed on
Jun 8, 2017
Sold by
Bald Michael and Bald Meagan
Bought by
Provost And Martin Holdings Llc
Purchase Details
Closed on
Dec 6, 2013
Sold by
Bonestell Marguerite A and Bonestell Michael Lewis
Bought by
Bald Michael and Bald Megan
Home Financials for this Owner
Home Financials are based on the most recent Mortgage that was taken out on this home.
Original Mortgage
$148,650
Interest Rate
4.16%
Mortgage Type
New Conventional
Create a Home Valuation Report for This Property
The Home Valuation Report is an in-depth analysis detailing your home's value as well as a comparison with similar homes in the area
Home Values in the Area
Average Home Value in this Area
Purchase History
| Date | Buyer | Sale Price | Title Company |
|---|---|---|---|
| Provost Jonathan M | -- | None Listed On Document | |
| Provost And Martin Holdings Llc | $185,000 | None Available | |
| Bald Michael | $156,500 | None Available |
Source: Public Records
Mortgage History
| Date | Status | Borrower | Loan Amount |
|---|---|---|---|
| Open | Provost Jonathan M | $190,000 | |
| Previous Owner | Bald Michael | $148,650 |
Source: Public Records
Tax History
| Year | Tax Paid | Tax Assessment Tax Assessment Total Assessment is a certain percentage of the fair market value that is determined by local assessors to be the total taxable value of land and additions on the property. | Land | Improvement |
|---|---|---|---|---|
| 2025 | $3,590 | $416,561 | $210,000 | $206,561 |
| 2024 | $3,513 | $416,561 | $210,000 | $206,561 |
Source: Public Records
Map
Nearby Homes
- 117 Red Bud Ct
- 102 Joel Ct
- 316 Howland Ave
- 143 Hedgerow Ct
- 509 Matheson Place
- 104 Bayoak Dr
- 101 Hedgerow Ct
- 207 High House Rd
- 209 High House Rd
- 136 Orchard Park Dr
- 1115 Contessa Dr
- 3020 Winfred Dell Ln
- 507 Maple St
- 1017 Frank Page Dr
- 101 Oscar Ln
- 930 Madison Ave
- 723 Springfork Dr Unit 422
- 136 Lake Hollow Cir
- 415 W Chatham St
- 631 Springfork Dr Unit 5C3
- 217 Howland Ave
- 215 Howland Ave
- 130 Sycamore St
- 139 Sycamore St
- 135 Sycamore St
- 141 Sycamore St
- 112 Sycamore St
- 301 Howland Ave
- 133 Sycamore St
- 131 Sycamore St
- 218 Howland Ave
- 220 Howland Ave
- 211 Howland Ave
- 110 Sycamore St
- 303 Howland Ave
- 129 Red Bud Ct
- 121 Joel Ct
- 300 Howland Ave
- 214 Howland Ave
- 123 Joel Ct
Your Personal Tour Guide
Ask me questions while you tour the home.