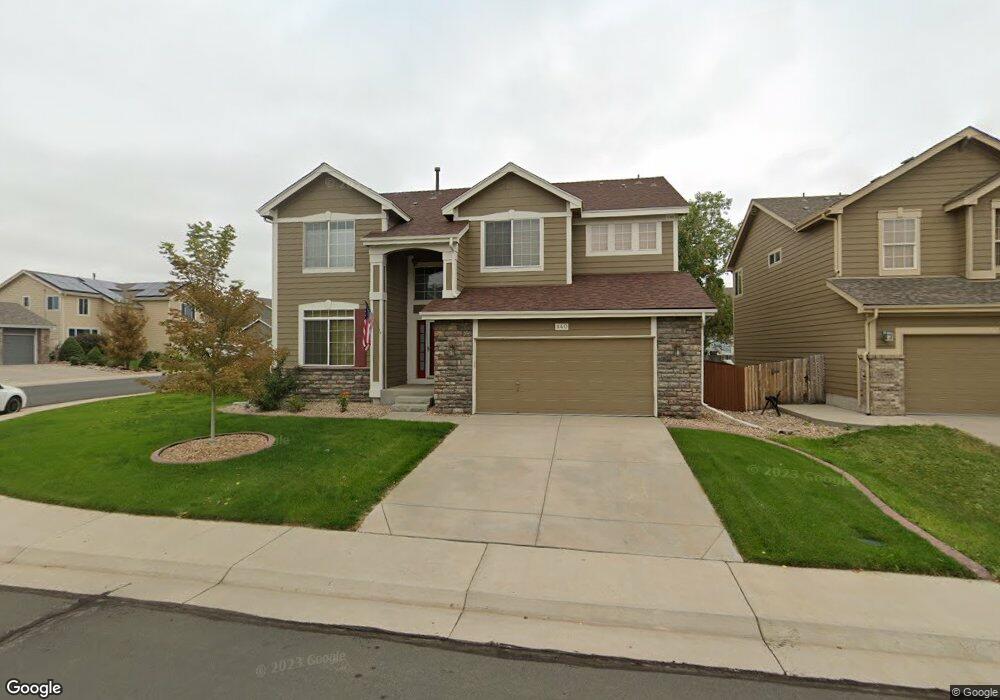
140 Terra Vista St Brighton, CO 80601
Estimated Value: $563,399 - $668,000
4
Beds
3
Baths
3,969
Sq Ft
$154/Sq Ft
Est. Value
About This Home
This home is located at 140 Terra Vista St, Brighton, CO 80601 and is currently estimated at $612,350, approximately $154 per square foot. 140 Terra Vista St is a home located in Adams County with nearby schools including Pennock Elementary School, Overland Trail Middle School, and Brighton High School.
Ownership History
Date
Name
Owned For
Owner Type
Purchase Details
Closed on
Oct 10, 2017
Sold by
Muzziapa Christina
Bought by
Muzzipapa Christian M
Current Estimated Value
Home Financials for this Owner
Home Financials are based on the most recent Mortgage that was taken out on this home.
Original Mortgage
$212,000
Outstanding Balance
$177,080
Interest Rate
3.82%
Mortgage Type
New Conventional
Estimated Equity
$435,270
Purchase Details
Closed on
Apr 14, 2017
Sold by
Rael Dina L
Bought by
Muzzipapa Christina
Home Financials for this Owner
Home Financials are based on the most recent Mortgage that was taken out on this home.
Original Mortgage
$311,200
Outstanding Balance
$258,182
Interest Rate
4.1%
Mortgage Type
New Conventional
Estimated Equity
$354,168
Purchase Details
Closed on
Jul 25, 2001
Sold by
The Ryland Group Inc
Bought by
Rael Dina L
Home Financials for this Owner
Home Financials are based on the most recent Mortgage that was taken out on this home.
Original Mortgage
$160,500
Interest Rate
7.07%
Create a Home Valuation Report for This Property
The Home Valuation Report is an in-depth analysis detailing your home's value as well as a comparison with similar homes in the area
Home Values in the Area
Average Home Value in this Area
Purchase History
| Date | Buyer | Sale Price | Title Company |
|---|---|---|---|
| Muzzipapa Christian M | -- | Chicago Title | |
| Muzzipapa Christina | $389,000 | 8Z Title | |
| Rael Dina L | $300,088 | -- |
Source: Public Records
Mortgage History
| Date | Status | Borrower | Loan Amount |
|---|---|---|---|
| Open | Muzzipapa Christian M | $212,000 | |
| Open | Muzzipapa Christina | $311,200 | |
| Previous Owner | Rael Dina L | $160,500 |
Source: Public Records
Tax History Compared to Growth
Tax History
| Year | Tax Paid | Tax Assessment Tax Assessment Total Assessment is a certain percentage of the fair market value that is determined by local assessors to be the total taxable value of land and additions on the property. | Land | Improvement |
|---|---|---|---|---|
| 2024 | $4,244 | $36,190 | $7,190 | $29,000 |
| 2023 | $4,219 | $41,750 | $6,770 | $34,980 |
| 2022 | $3,477 | $31,350 | $6,950 | $24,400 |
| 2021 | $3,273 | $31,350 | $6,950 | $24,400 |
| 2020 | $2,984 | $29,870 | $7,150 | $22,720 |
| 2019 | $2,991 | $29,870 | $7,150 | $22,720 |
| 2018 | $2,623 | $26,120 | $6,120 | $20,000 |
| 2017 | $2,627 | $26,120 | $6,120 | $20,000 |
| 2016 | $2,253 | $22,280 | $4,460 | $17,820 |
| 2015 | $2,237 | $22,280 | $4,460 | $17,820 |
| 2014 | $1,879 | $18,940 | $3,580 | $15,360 |
Source: Public Records
Map
Nearby Homes
- 220 Terra Vista St
- 334 Octillo St
- 291 Las Lomas St
- 3060 E Bridge St Unit 159
- 3060 E Bridge St Unit 213
- 3060 E Bridge St Unit 303
- 3060 E Bridge St Unit 277
- 467 S 36th Ave
- 3745 Balderas St
- 147 Chapel Hill Cir
- 3938 Balderas St
- 156 Chapel Hill Cir
- 3978 Balderas St
- 3563 Watada Dr
- 15421 Telluride St
- 2693 Mather St
- 2587 E Egbert St
- 3406 Purcell St
- 321 S 26th Ave
- 118 Foxglove Dr Unit 23D
- 150 Terra Vista St
- 143 Mesa St
- 160 Terra Vista St
- 153 Mesa St
- 111 Terra Vista St
- 112 Mesa St
- 151 Terra Vista St
- 163 Mesa St
- 121 Terra Vista St
- 141 Terra Vista St
- 170 Terra Vista St
- 161 Terra Vista St
- 131 Terra Vista St
- 173 Mesa St
- 122 Mesa St
- 171 Terra Vista St
- 180 Terra Vista St
- 183 Mesa St
- 152 Mesa St
- 181 Terra Vista St