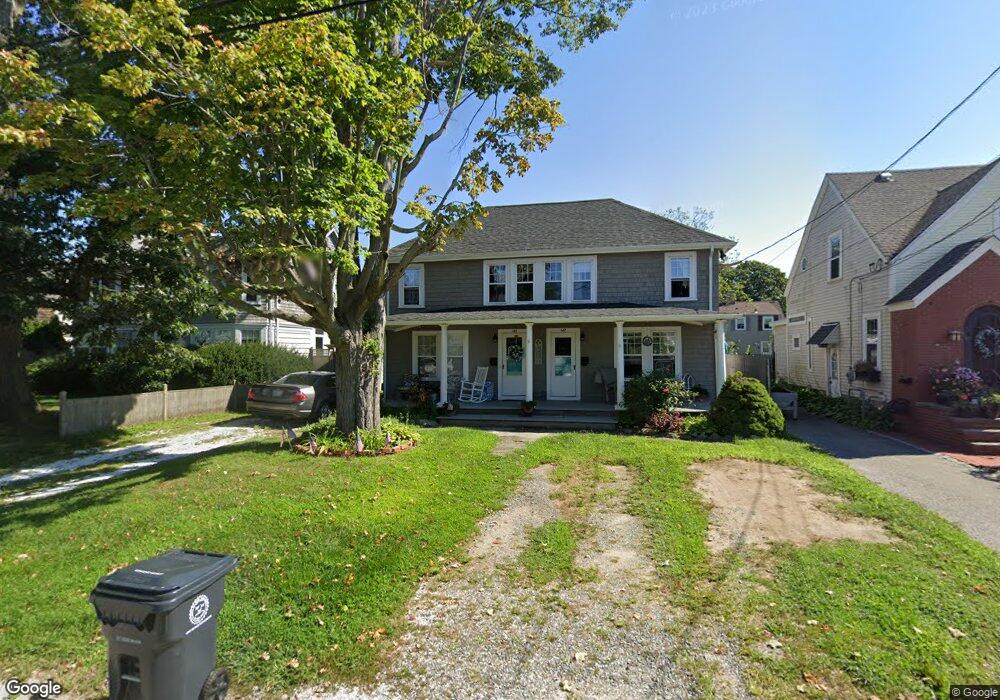
140 Terrace Ave Unit 142 Riverside, RI 02915
Riverside NeighborhoodEstimated Value: $505,000 - $578,000
4
Beds
2
Baths
1,800
Sq Ft
$307/Sq Ft
Est. Value
About This Home
This home is located at 140 Terrace Ave Unit 142, Riverside, RI 02915 and is currently estimated at $552,133, approximately $306 per square foot. 140 Terrace Ave Unit 142 is a home located in Providence County with nearby schools including East Providence High School, St Luke Elementary School, and St Mary Academy-Bay View.
Ownership History
Date
Name
Owned For
Owner Type
Purchase Details
Closed on
Jun 8, 2018
Sold by
Silver Cord Enterprise
Bought by
Silva Gilbert and Silva Joyce C
Current Estimated Value
Purchase Details
Closed on
Apr 14, 2009
Sold by
Hsbc Bank Usa
Bought by
Silver Cord Ent
Purchase Details
Closed on
Mar 11, 2004
Sold by
Marcoccia Nicole
Bought by
Kedem Nitsa
Home Financials for this Owner
Home Financials are based on the most recent Mortgage that was taken out on this home.
Original Mortgage
$212,000
Interest Rate
5.67%
Mortgage Type
Purchase Money Mortgage
Purchase Details
Closed on
Sep 26, 2001
Sold by
Tierney Michael
Bought by
Barrett Nicole M
Home Financials for this Owner
Home Financials are based on the most recent Mortgage that was taken out on this home.
Original Mortgage
$137,837
Interest Rate
6.91%
Mortgage Type
Purchase Money Mortgage
Create a Home Valuation Report for This Property
The Home Valuation Report is an in-depth analysis detailing your home's value as well as a comparison with similar homes in the area
Home Values in the Area
Average Home Value in this Area
Purchase History
We collect this data history from publicly available records. To have your information removed, we recommend requesting removal directly through your county’s website.
| Date | Buyer | Sale Price | Title Company |
|---|---|---|---|
| Silva Gilbert | -- | -- | |
| Silva Gilbert | -- | -- | |
| Silva Gilbert | -- | -- | |
| Silver Cord Ent | $135,000 | -- | |
| Silver Cord Ent | $135,000 | -- | |
| Kedem Nitsa | $265,000 | -- | |
| Kedem Nitsa | $265,000 | -- | |
| Barrett Nicole M | $140,000 | -- | |
| Barrett Nicole M | $140,000 | -- |
Source: Public Records
Mortgage History
We collect this data history from publicly available records. To have your information removed, we recommend requesting removal directly through your county’s website.
| Date | Status | Borrower | Loan Amount |
|---|---|---|---|
| Previous Owner | Barrett Nicole M | $212,000 | |
| Previous Owner | Barrett Nicole M | $137,837 |
Source: Public Records
Tax History
| Year | Tax Paid | Tax Assessment Tax Assessment Total Assessment is a certain percentage of the fair market value that is determined by local assessors to be the total taxable value of land and additions on the property. | Land | Improvement |
|---|---|---|---|---|
| 2025 | $5,891 | $450,700 | $131,400 | $319,300 |
| 2024 | $5,297 | $345,500 | $109,500 | $236,000 |
| 2023 | $5,100 | $345,500 | $109,500 | $236,000 |
| 2022 | $5,793 | $265,000 | $86,000 | $179,000 |
| 2021 | $5,698 | $265,000 | $86,000 | $179,000 |
| 2020 | $5,456 | $265,000 | $86,000 | $179,000 |
| 2019 | $5,305 | $265,000 | $86,000 | $179,000 |
| 2018 | $4,876 | $213,100 | $95,300 | $117,800 |
| 2017 | $4,767 | $213,100 | $95,300 | $117,800 |
| 2016 | $4,744 | $213,100 | $95,300 | $117,800 |
| 2015 | $4,581 | $199,600 | $73,500 | $126,100 |
| 2014 | $4,581 | $199,600 | $73,500 | $126,100 |
Source: Public Records
Map
Nearby Homes
- 916 Bullocks Pt Ave
- 233 Terrace Ave
- 858 Bullocks Point Ave
- 0 Carousel Dr
- 13 Harding Ave
- 15 Shore Dr Unit 17
- 140 Beacon Park Dr
- 285 Narragansett Ave
- 53 White Ave
- 41 Rogers Ave
- 28 Byway Rd
- 3 Haines Park Rd
- 45 Metropolitan Park Dr
- 17 Sherman St
- 131 Anson Dr
- 57 Park Dr
- 79 Sherman St
- 63 Alfred Drowne Rd
- 19 Salisbury Rd
- 108 Hilton Ave
- 985 Bullocks Point Ave
- 983 Bullocks Point Ave
- 144 Terrace Ave
- 148 Terrace Ave Unit 150
- 15 Myrtle Ave
- 148-150 Terrace Ave
- 978 Bullocks Point Ave
- 152 Terrace Ave
- 984 Bullocks Point Ave
- 138 Terrace Ave
- 18 Poplar Ave
- 134 Terrace Ave
- 154 Terrace Ave
- 3 Myrtle Ave
- 20 Myrtle Ave
- 1005 Bullocks Point Ave
- 990 Bullocks Point Ave
- 965 Bullocks Point Ave
- 145 Terrace Ave Unit 147
- 162 Terrace Ave
Your Personal Tour Guide
Ask me questions while you tour the home.