Estimated Value: $634,000 - $734,000
4
Beds
3
Baths
2,200
Sq Ft
$320/Sq Ft
Est. Value
About This Home
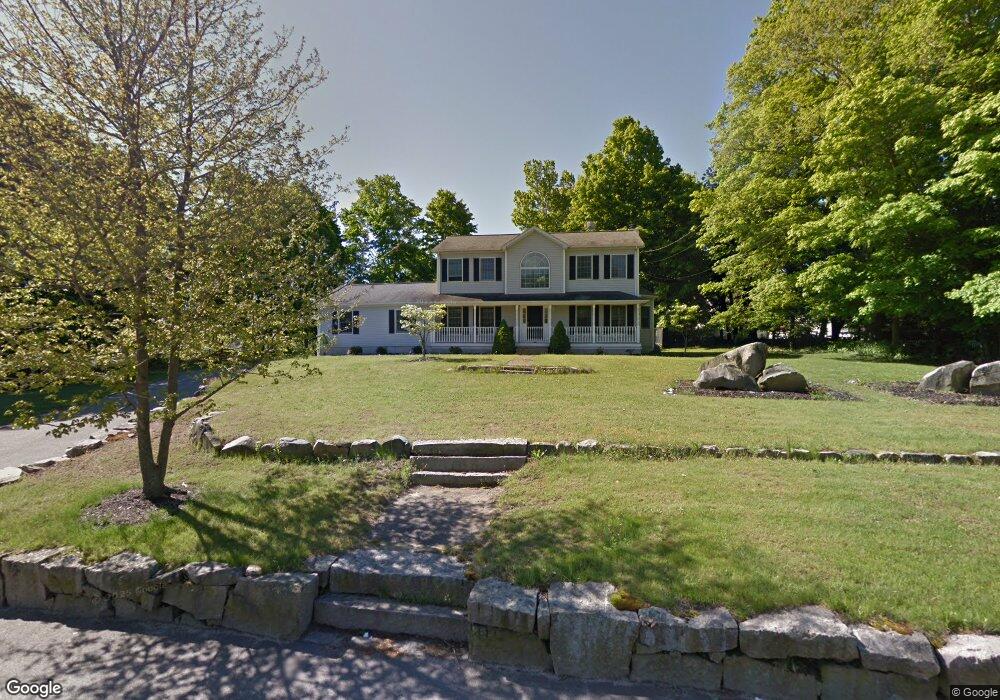
This home is located at 140 W High St, Avon, MA 02322 and is currently estimated at $704,949, approximately $320 per square foot. 140 W High St is a home located in Norfolk County with nearby schools including Ralph D. Butler Elementary School, Avon Middle/High School, and Lighthouse Baptist Christian Academy.
Ownership History
Date
Name
Owned For
Owner Type
Purchase Details
Closed on
May 4, 2009
Sold by
Shea Paul C and Legrice Christine
Bought by
Legrice Douglas G and Legrice Christine
Current Estimated Value
Purchase Details
Closed on
Apr 30, 2009
Sold by
Gregory Patrick
Bought by
Shea Paul and Legrice Christine
Purchase Details
Closed on
Jun 19, 1998
Sold by
Wight David E
Bought by
250 W High Street T
Create a Home Valuation Report for This Property
The Home Valuation Report is an in-depth analysis detailing your home's value as well as a comparison with similar homes in the area
Home Values in the Area
Average Home Value in this Area
Purchase History
| Date | Buyer | Sale Price | Title Company |
|---|---|---|---|
| Legrice Douglas G | -- | -- | |
| Shea Paul | $285,000 | -- | |
| 250 W High Street T | $66,600 | -- |
Source: Public Records
Mortgage History
| Date | Status | Borrower | Loan Amount |
|---|---|---|---|
| Previous Owner | 250 W High Street T | $250,000 |
Source: Public Records
Tax History Compared to Growth
Tax History
| Year | Tax Paid | Tax Assessment Tax Assessment Total Assessment is a certain percentage of the fair market value that is determined by local assessors to be the total taxable value of land and additions on the property. | Land | Improvement |
|---|---|---|---|---|
| 2025 | $87 | $648,600 | $210,700 | $437,900 |
| 2024 | $8,087 | $576,400 | $199,700 | $376,700 |
| 2023 | $7,851 | $576,400 | $199,700 | $376,700 |
| 2022 | $8,620 | $545,200 | $166,300 | $378,900 |
| 2021 | $7,668 | $457,000 | $150,700 | $306,300 |
| 2020 | $7,675 | $433,600 | $147,800 | $285,800 |
| 2019 | $7,844 | $436,000 | $147,800 | $288,200 |
| 2018 | $8,136 | $438,600 | $147,800 | $290,800 |
| 2017 | $6,509 | $376,700 | $147,800 | $228,900 |
| 2016 | $6,673 | $390,000 | $148,100 | $241,900 |
| 2015 | $6,162 | $376,400 | $134,500 | $241,900 |
Source: Public Records
Map
Nearby Homes