Estimated Value: $366,000 - $432,000
4
Beds
3
Baths
1,936
Sq Ft
$203/Sq Ft
Est. Value
About This Home
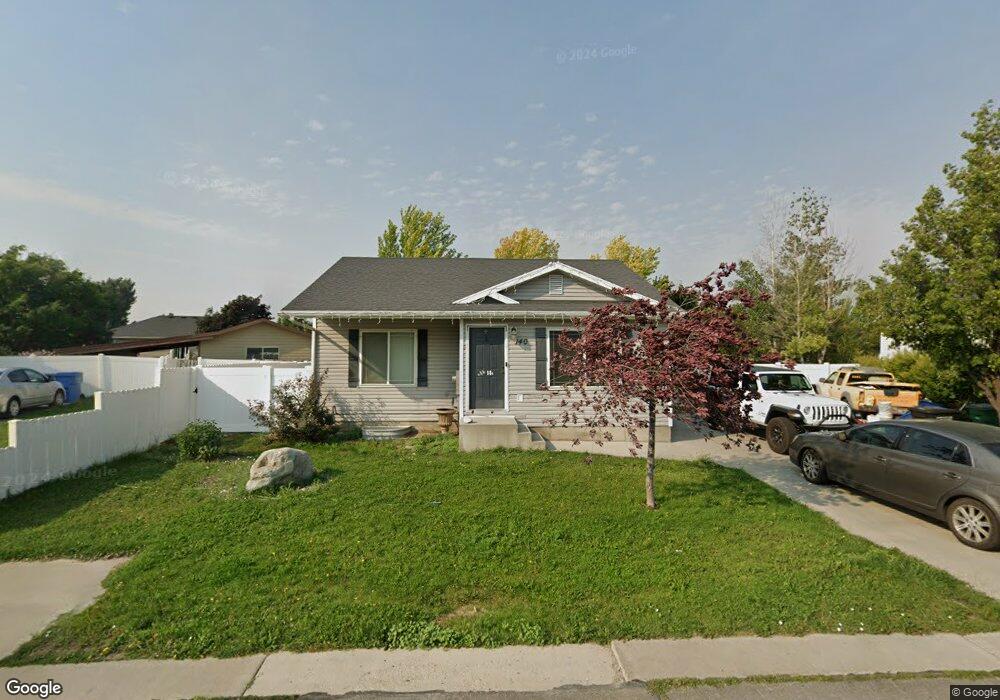
This home is located at 140 Wapiti Loop, Hyrum, UT 84319 and is currently estimated at $392,818, approximately $202 per square foot. 140 Wapiti Loop is a home located in Cache County with nearby schools including Canyon School, South Cache Middle School, and Mountain Crest High School.
Ownership History
Date
Name
Owned For
Owner Type
Purchase Details
Closed on
Aug 22, 2025
Sold by
Nielsen Blayne K and Nielsen Cherry
Bought by
Castaneda Edgar Salome
Current Estimated Value
Home Financials for this Owner
Home Financials are based on the most recent Mortgage that was taken out on this home.
Original Mortgage
$165,000
Outstanding Balance
$164,857
Interest Rate
6.72%
Mortgage Type
New Conventional
Estimated Equity
$227,961
Purchase Details
Closed on
Apr 30, 2018
Sold by
Heimann John and Heimann Kaisha
Bought by
Nielsen Blayne K and Nielsen Cherry
Home Financials for this Owner
Home Financials are based on the most recent Mortgage that was taken out on this home.
Original Mortgage
$154,400
Interest Rate
4.4%
Mortgage Type
Construction
Purchase Details
Closed on
Jun 14, 2013
Sold by
Kaha Kaniala Beau
Bought by
Heimann John and Heimann Kaisha
Home Financials for this Owner
Home Financials are based on the most recent Mortgage that was taken out on this home.
Original Mortgage
$152,793
Interest Rate
3.32%
Mortgage Type
New Conventional
Purchase Details
Closed on
May 22, 2011
Sold by
Barlow Michael H and Barlow Laura J
Bought by
Kaha Kaniala Beau
Home Financials for this Owner
Home Financials are based on the most recent Mortgage that was taken out on this home.
Original Mortgage
$138,860
Interest Rate
4.84%
Mortgage Type
New Conventional
Create a Home Valuation Report for This Property
The Home Valuation Report is an in-depth analysis detailing your home's value as well as a comparison with similar homes in the area
Home Values in the Area
Average Home Value in this Area
Purchase History
| Date | Buyer | Sale Price | Title Company |
|---|---|---|---|
| Castaneda Edgar Salome | -- | Northern Title Company | |
| Nielsen Blayne K | -- | Stewart Title | |
| Heimann John | -- | Cache Title Logan | |
| Kaha Kaniala Beau | -- | Northern Title Company |
Source: Public Records
Mortgage History
| Date | Status | Borrower | Loan Amount |
|---|---|---|---|
| Open | Castaneda Edgar Salome | $165,000 | |
| Previous Owner | Nielsen Blayne K | $154,400 | |
| Previous Owner | Heimann John | $152,793 | |
| Previous Owner | Kaha Kaniala Beau | $138,860 |
Source: Public Records
Tax History Compared to Growth
Tax History
| Year | Tax Paid | Tax Assessment Tax Assessment Total Assessment is a certain percentage of the fair market value that is determined by local assessors to be the total taxable value of land and additions on the property. | Land | Improvement |
|---|---|---|---|---|
| 2025 | $1,406 | $201,925 | $0 | $0 |
| 2024 | $1,498 | $200,895 | $0 | $0 |
| 2023 | $1,505 | $192,955 | $0 | $0 |
| 2022 | $1,571 | $192,955 | $0 | $0 |
| 2021 | $1,549 | $293,265 | $63,000 | $230,265 |
| 2020 | $1,436 | $255,153 | $63,000 | $192,153 |
| 2019 | $1,360 | $227,153 | $35,000 | $192,153 |
| 2018 | $1,251 | $202,090 | $35,000 | $167,090 |
| 2017 | $1,226 | $102,795 | $0 | $0 |
| 2016 | $1,254 | $82,005 | $0 | $0 |
| 2015 | $892 | $72,910 | $0 | $0 |
| 2014 | $872 | $72,910 | $0 | $0 |
| 2013 | -- | $72,910 | $0 | $0 |
Source: Public Records
Map
Nearby Homes
- 146 Wapiti Loop
- 134 Wapiti Loop
- 1137 E Hyrum Blvd
- 137 Wapiti Loop
- 152 Wapiti Loop
- 129 S 1100 E
- 1125 E Hyrum Blvd
- 155 Wapiti Loop
- 128 Wapiti Loop
- 139 S 1100 E
- 117 S 1100 E
- 1151 E Hyrum Blvd
- 1136 Tule Dr
- 131 Wapiti Loop
- 158 Wapiti Loop
- 122 Wapiti Loop
- 1148 Tule Dr
- 125 Wapiti Loop
- 101 S 1100 E
- 1163 E Hyrum Blvd