
140 Washington St SE Calhoun, GA 30701
Estimated payment $2,231/month
Highlights
- Dining Room Seats More Than Twelve
- Deck
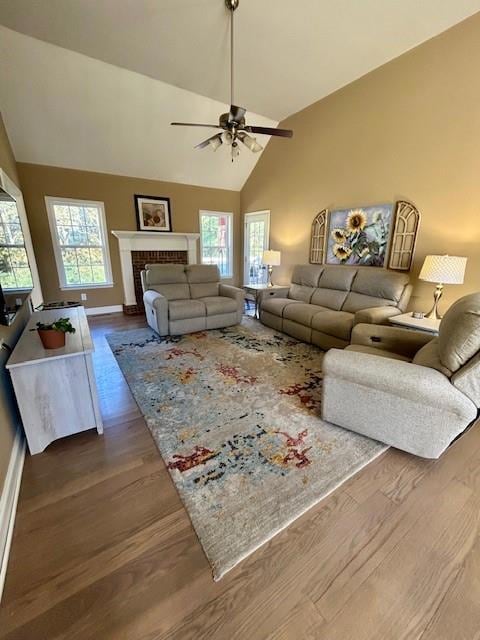
- Wood Flooring
- Sonoraville Elementary School Rated A-
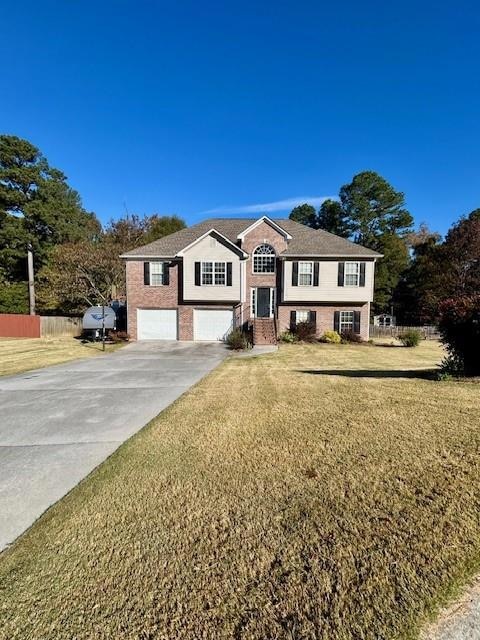
- Traditional Architecture
- Main Floor Primary Bedroom
About This Home
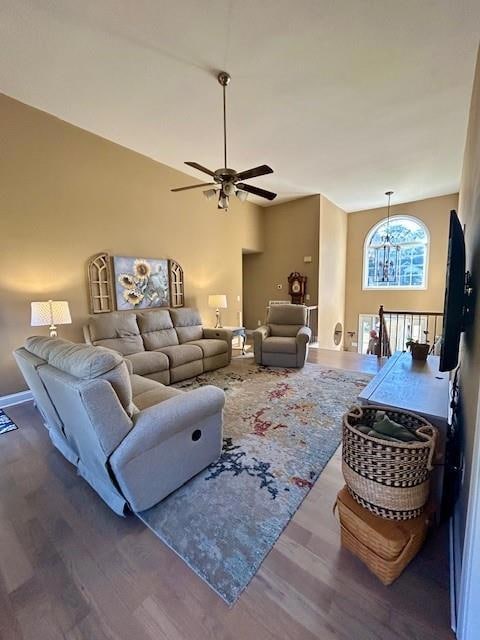
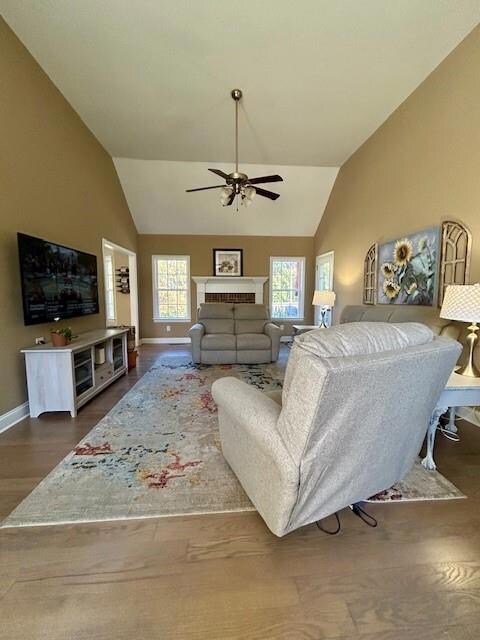
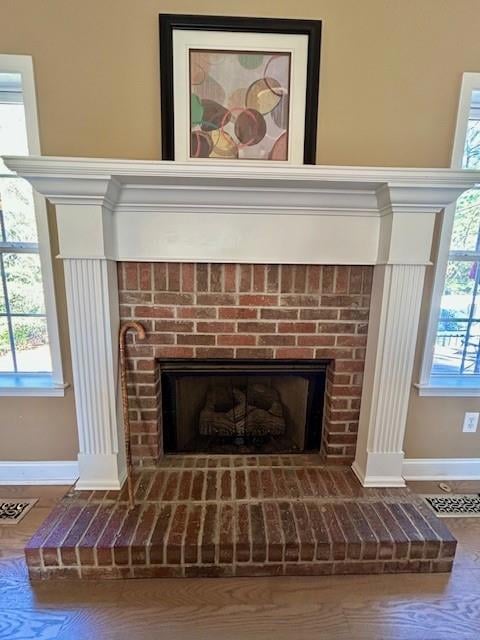
Tons of space for the family in this traditional 4-bedroom, 3 bath home located on a cul-de-sac lot in Sonoraville school district! Great room with Soaring ceilings and gas log fireplace for the cozy nights, completely remodeled kitchen with gas range, quartz countertops, and tons of bright white custom cabinetry with tile backsplash and stainless appliances, oversized dining room fit for the Brady bunch, Owner's suite with tray ceiling, access to back deck to enjoy the morning coffee, bathroom with soaking tub, double sinks and separate shower, 2 additional bedrooms on main level. Finished basement with den, bonus space for exercise room/playroom, plus additional bedroom and workshop for the handyman, fenced backyard with double decks, firepit area, approx. 10x18 Storage building and tons of space for the kids or dogs. Roof replaced 5 years ago, water heater and HVAC replaced 4 years ago, Hardwood flooring refinished 5 years ago, plus alot more!
Listing Agent
Samantha Lusk & Associates Realty, Inc. License #176666 Listed on: 11/01/2025
Home Details
Home Type
- Single Family
Est. Annual Taxes
- $2,711
Year Built
- Built in 2003
Lot Details
- 0.62 Acre Lot
- Property fronts a county road
- Cul-De-Sac
- Level Lot
- Back Yard Fenced
HOA Fees
- $25 Monthly HOA Fees
Parking
- 2 Car Garage
- Driveway
Home Design
- Traditional Architecture
- Split Level Home
- Block Foundation
- Composition Roof
- Vinyl Siding
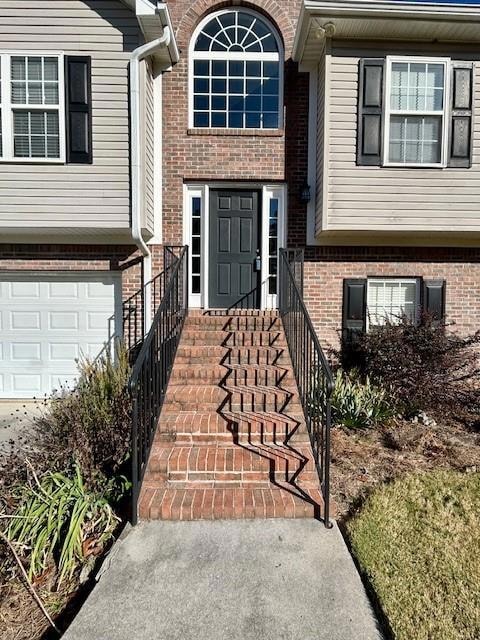
- Brick Front
Interior Spaces
- 2,522 Sq Ft Home
- Rear Stairs
- Tray Ceiling
- Ceiling Fan
- Gas Log Fireplace
- Double Pane Windows
- Two Story Entrance Foyer
- Great Room with Fireplace
- Dining Room Seats More Than Twelve
- Breakfast Room
- Formal Dining Room
- Den
- Bonus Room
- Workshop
- Home Gym
- Neighborhood Views
- Pull Down Stairs to Attic
- Fire and Smoke Detector
Kitchen
- Gas Range
- Microwave
- Dishwasher
- Solid Surface Countertops
- White Kitchen Cabinets
Flooring
- Wood
- Carpet
Bedrooms and Bathrooms
- 4 Bedrooms | 3 Main Level Bedrooms
- Primary Bedroom on Main
- Split Bedroom Floorplan
- Walk-In Closet
- Dual Vanity Sinks in Primary Bathroom
- Separate Shower in Primary Bathroom
- Soaking Tub
Laundry
- Laundry Room
- Laundry on lower level
Basement
- Finished Basement Bathroom
- Natural lighting in basement
Outdoor Features
- Deck
- Covered Patio or Porch
- Outdoor Storage
Schools
- Sonoraville Elementary School
- Red Bud Middle School
- Sonoraville High School
Utilities
- Air Source Heat Pump
- 110 Volts
- Septic Tank
Community Details
- The Orchard Subdivision
Listing and Financial Details
- Tax Lot 62
- Assessor Parcel Number 067 261
Map
Home Values in the Area
Average Home Value in this Area
Tax History
| Year | Tax Paid | Tax Assessment Tax Assessment Total Assessment is a certain percentage of the fair market value that is determined by local assessors to be the total taxable value of land and additions on the property. | Land | Improvement |
|---|---|---|---|---|
| 2024 | $2,711 | $108,720 | $7,000 | $101,720 |
| 2023 | $2,529 | $101,560 | $7,000 | $94,560 |
| 2022 | $2,510 | $94,920 | $7,000 | $87,920 |
| 2021 | $2,177 | $79,720 | $7,000 | $72,720 |
| 2020 | $2,250 | $80,520 | $7,000 | $73,520 |
| 2019 | $2,262 | $80,520 | $7,000 | $73,520 |
| 2018 | $2,152 | $76,720 | $7,000 | $69,720 |
| 2017 | $1,878 | $65,360 | $6,280 | $59,080 |
| 2016 | $1,774 | $61,720 | $5,920 | $55,800 |
| 2015 | $1,757 | $60,600 | $5,920 | $54,680 |
| 2014 | $1,638 | $58,256 | $5,950 | $52,306 |
Property History
| Date | Event | Price | List to Sale | Price per Sq Ft |
|---|---|---|---|---|
| 11/01/2025 11/01/25 | For Sale | $374,900 | -- | $149 / Sq Ft |
Purchase History
| Date | Type | Sale Price | Title Company |
|---|---|---|---|
| Warranty Deed | -- | -- | |
| Warranty Deed | -- | -- | |
| Deed | $182,000 | -- | |
| Deed | $167,300 | -- | |
| Deed | $25,000 | -- | |
| Deed | -- | -- |
Mortgage History
| Date | Status | Loan Amount | Loan Type |
|---|---|---|---|
| Open | $155,200 | New Conventional |
Source: First Multiple Listing Service (FMLS)
MLS Number: 7675177
APN: 067-261
Disclaimer: Certain information contained herein is derived from information provided by parties other than Homes.com. All information provided is deemed reliable, but is not guaranteed to be accurate and should be independently verified.
![]() Listings identified with the FMLS IDX logo come from FMLS and are held by brokerage firms other than the owner of this website. The listing brokerage is identified in any listing details. Information is deemed reliable but is not guaranteed. If you believe any FMLS listing contains material that infringes your copyrighted work please visit www.fmls.com/dmca to review our DMCA policy and learn how to submit a takedown request. © 2025 First Multiple Listing Service, Inc.
Listings identified with the FMLS IDX logo come from FMLS and are held by brokerage firms other than the owner of this website. The listing brokerage is identified in any listing details. Information is deemed reliable but is not guaranteed. If you believe any FMLS listing contains material that infringes your copyrighted work please visit www.fmls.com/dmca to review our DMCA policy and learn how to submit a takedown request. © 2025 First Multiple Listing Service, Inc.
- 219 Orchard Way SE
- 221 Hunters Crossing SE
- 137 Orchard Way SE
- 130 Orchard Way SE
- 254 Gravely Rd SE
- 320 Wrights Hollow Rd SE
- 251 Tucker Hollow Rd SE
- 106 Valley View Cir SE
- 3171 Dews Pond Rd SE
- 225 Lovebridge Dr SE
- 224 Shadowood Dr SE
- 371 Lake Dr SE
- 158 Shadowood Dr SE
- The Alston Plan at Salacoa - The Overlook at Salacoa
- The Hartwell Plan at Salacoa - The Overlook at Salacoa
- The Perry Plan at Salacoa - The Overlook at Salacoa
- The Dalton Plan at Salacoa - The Overlook at Salacoa
- The Springfield Plan at Salacoa - The Overlook at Salacoa
- The Dexter Plan at Salacoa - The Overlook at Salacoa
- 351 Valley View Cir SE
- 102 Lavender Cir
- 100 Harvest Grove Ln
- 415 Curtis Pkwy SE
- 81 Professional Place
- 100 Harvest Grove Ln Unit Roland
- 100 Harvest Grove Ln Unit Hayes
- 67 Professional Place
- 509 Mount Vernon Dr
- 73 Professional Place
- 150 Oakleigh Dr
- 75 Professional Place
- 59 Professional Place
- 83 Professional Place
- 67 Professional Place
- 77 Professional Place
- 108 Cornwell Way
- 204 Cornwell Way
- 213 Cornwell Way
- 100 Watlington Dr
