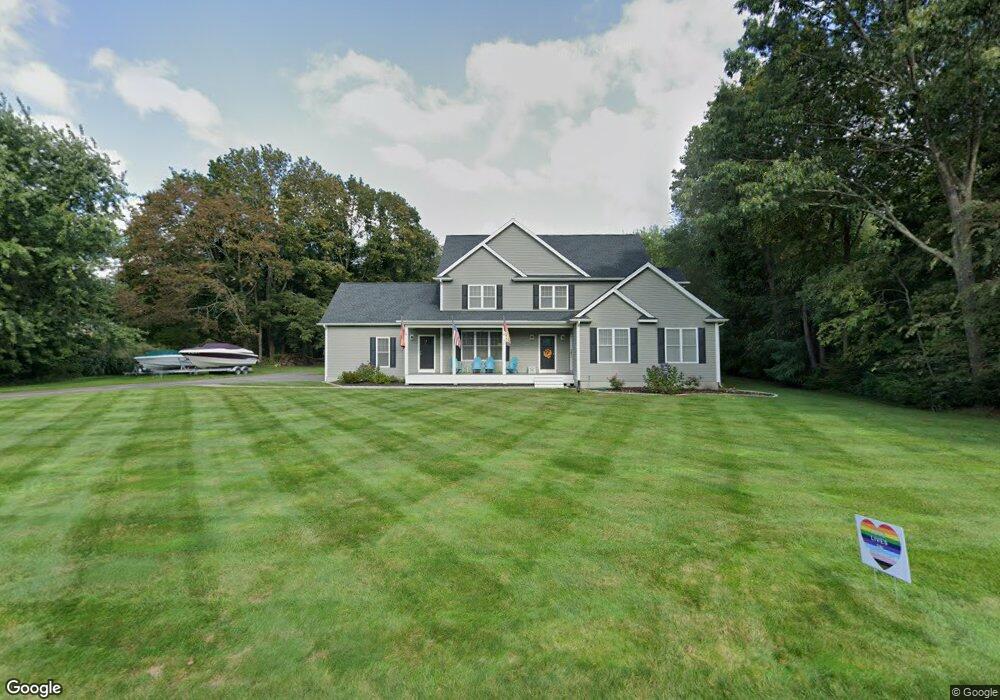
140 West Ave Seekonk, MA 02771
Estimated Value: $876,000 - $1,099,000
3
Beds
4
Baths
2,916
Sq Ft
$341/Sq Ft
Est. Value
About This Home
This home is located at 140 West Ave, Seekonk, MA 02771 and is currently estimated at $995,520, approximately $341 per square foot. 140 West Ave is a home with nearby schools including Seekonk High School, St Margaret School, and The Wolf School.
Ownership History
Date
Name
Owned For
Owner Type
Purchase Details
Closed on
Jun 17, 2021
Sold by
Mello Christopher J and Mello Stephanie T
Bought by
Mello Stephanie T
Current Estimated Value
Home Financials for this Owner
Home Financials are based on the most recent Mortgage that was taken out on this home.
Original Mortgage
$460,000
Outstanding Balance
$403,308
Interest Rate
2.9%
Mortgage Type
Stand Alone Refi Refinance Of Original Loan
Estimated Equity
$592,212
Create a Home Valuation Report for This Property
The Home Valuation Report is an in-depth analysis detailing your home's value as well as a comparison with similar homes in the area
Home Values in the Area
Average Home Value in this Area
Purchase History
| Date | Buyer | Sale Price | Title Company |
|---|---|---|---|
| Mello Stephanie T | -- | None Available | |
| Mello Stephanie T | -- | None Available |
Source: Public Records
Mortgage History
| Date | Status | Borrower | Loan Amount |
|---|---|---|---|
| Open | Mello Stephanie T | $460,000 |
Source: Public Records
Tax History Compared to Growth
Tax History
| Year | Tax Paid | Tax Assessment Tax Assessment Total Assessment is a certain percentage of the fair market value that is determined by local assessors to be the total taxable value of land and additions on the property. | Land | Improvement |
|---|---|---|---|---|
| 2025 | $11,138 | $901,900 | $216,000 | $685,900 |
| 2024 | $10,610 | $859,100 | $216,000 | $643,100 |
| 2023 | $10,158 | $774,800 | $198,200 | $576,600 |
| 2022 | $9,143 | $685,400 | $192,100 | $493,300 |
| 2021 | $8,955 | $659,900 | $175,500 | $484,400 |
| 2020 | $8,582 | $651,600 | $175,300 | $476,300 |
| 2019 | $8,267 | $633,000 | $175,300 | $457,700 |
| 2018 | $8,065 | $604,100 | $175,300 | $428,800 |
| 2017 | $7,569 | $562,300 | $168,300 | $394,000 |
| 2016 | $4,813 | $358,900 | $168,300 | $190,600 |
| 2015 | $1,929 | $145,800 | $145,800 | $0 |
Source: Public Records
Map
Nearby Homes