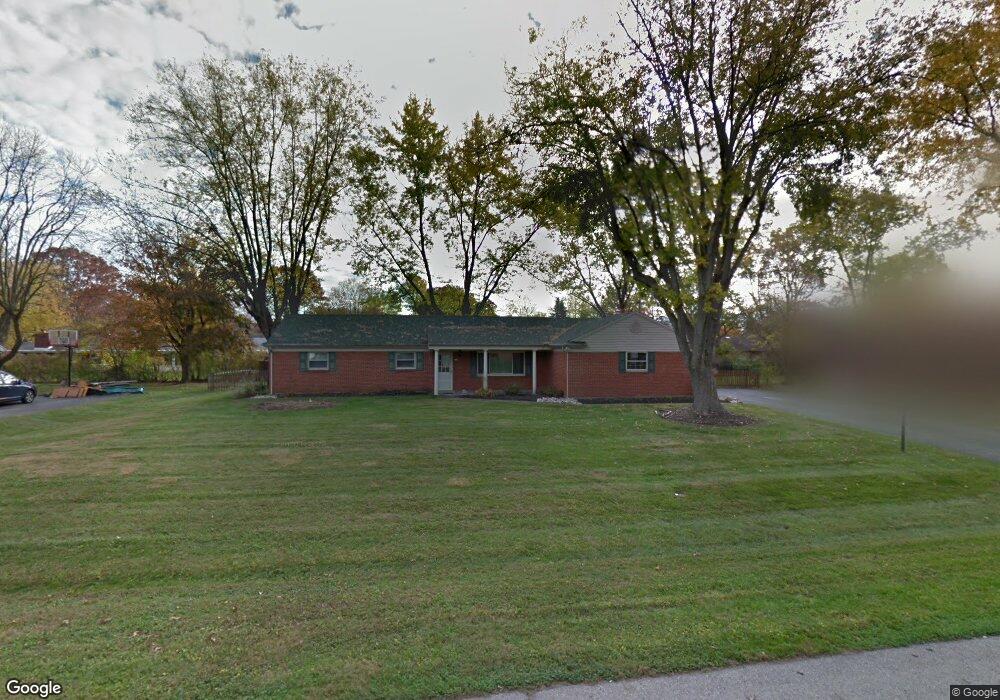
140 Winchcombe Dr Dayton, OH 45459
Woodbourne-Hyde Park NeighborhoodEstimated Value: $300,000 - $323,000
3
Beds
3
Baths
1,736
Sq Ft
$178/Sq Ft
Est. Value
About This Home
This home is located at 140 Winchcombe Dr, Dayton, OH 45459 and is currently estimated at $308,190, approximately $177 per square foot. 140 Winchcombe Dr is a home located in Montgomery County with nearby schools including Primary Village North, John Hole Elementary, and Hadley E Watts Middle School.
Ownership History
Date
Name
Owned For
Owner Type
Purchase Details
Closed on
Jul 17, 2017
Sold by
Andrade Alberto and Pazmino Monica
Bought by
Pryor Nina J and Vanzanten Joel
Current Estimated Value
Purchase Details
Closed on
Jan 21, 2005
Sold by
Andrade Alberto and Pazmino Monica
Bought by
Andrade Alberto and Pazmino Monica
Purchase Details
Closed on
Jun 16, 2003
Sold by
Hicks Teresa L
Bought by
Andrade Alberto and Palomino Monica
Home Financials for this Owner
Home Financials are based on the most recent Mortgage that was taken out on this home.
Original Mortgage
$141,206
Interest Rate
5.47%
Mortgage Type
FHA
Purchase Details
Closed on
Dec 12, 2001
Sold by
Fiely Gregory G and Fiely Melody S
Bought by
Hicks Teresa L
Home Financials for this Owner
Home Financials are based on the most recent Mortgage that was taken out on this home.
Original Mortgage
$115,200
Interest Rate
6.6%
Create a Home Valuation Report for This Property
The Home Valuation Report is an in-depth analysis detailing your home's value as well as a comparison with similar homes in the area
Home Values in the Area
Average Home Value in this Area
Purchase History
| Date | Buyer | Sale Price | Title Company |
|---|---|---|---|
| Pryor Nina J | $165,000 | None Available | |
| Andrade Alberto | -- | None Available | |
| Andrade Alberto | $148,000 | Title Resolutions | |
| Hicks Teresa L | $144,000 | -- |
Source: Public Records
Mortgage History
| Date | Status | Borrower | Loan Amount |
|---|---|---|---|
| Previous Owner | Andrade Alberto | $141,206 | |
| Previous Owner | Hicks Teresa L | $115,200 |
Source: Public Records
Tax History Compared to Growth
Tax History
| Year | Tax Paid | Tax Assessment Tax Assessment Total Assessment is a certain percentage of the fair market value that is determined by local assessors to be the total taxable value of land and additions on the property. | Land | Improvement |
|---|---|---|---|---|
| 2024 | $4,930 | $79,910 | $14,680 | $65,230 |
| 2023 | $4,930 | $79,910 | $14,680 | $65,230 |
| 2022 | $4,486 | $57,510 | $10,560 | $46,950 |
| 2021 | $4,498 | $57,510 | $10,560 | $46,950 |
| 2020 | $4,492 | $57,510 | $10,560 | $46,950 |
| 2019 | $4,471 | $51,150 | $10,560 | $40,590 |
| 2018 | $3,994 | $51,150 | $10,560 | $40,590 |
| 2017 | $3,951 | $51,150 | $10,560 | $40,590 |
| 2016 | $3,906 | $47,660 | $10,560 | $37,100 |
| 2015 | $3,843 | $47,660 | $10,560 | $37,100 |
| 2014 | $3,843 | $47,660 | $10,560 | $37,100 |
| 2012 | -- | $43,110 | $10,630 | $32,480 |
Source: Public Records
Map
Nearby Homes
- 187 Cheltenham Dr
- 152 Cheltenham Dr
- 190 Winchcombe Dr
- 129 Lamp Lighter Trail
- 341 Cardigan Rd
- 40 Nicholson Ct Unit 4
- 24 Nicholson Ct Unit 10
- 5416 Landau Dr Unit 7
- 5416 Landau Dr Unit 5
- 5380 Landau Dr Unit 40
- 5328 Landau Dr Unit 49
- 5328 Landau Dr
- 427 Meadowview Dr
- 5290 Wheaton St
- 194 Brookmount Rd
- 110 Talawanda Trail
- 256 E Rahn Rd
- 5016 Far Hills Ave
- 5920 Mad River Rd
- 6000 Cobbleskill Ct
- 130 Winchcombe Dr
- 150 Winchcombe Dr
- 207 Cheltenham Dr
- 167 Cheltenham Dr
- 149 Winchcombe Dr
- 139 Winchcombe Dr
- 120 Winchcombe Dr
- 129 Winchcombe Dr
- 160 Winchcombe Dr
- 159 Winchcombe Dr
- 227 Cheltenham Dr
- 147 Cheltenham Dr
- 190 Cheltenham Dr
- 150 Ashford Dr
- 119 Winchcombe Dr
- 172 Cheltenham Dr
- 210 Cheltenham Dr
- 140 Ashford Dr
- 160 Ashford Dr
- 110 Winchcombe Dr