Estimated Value: $193,955 - $301,000
--
Bed
--
Bath
2,456
Sq Ft
$101/Sq Ft
Est. Value
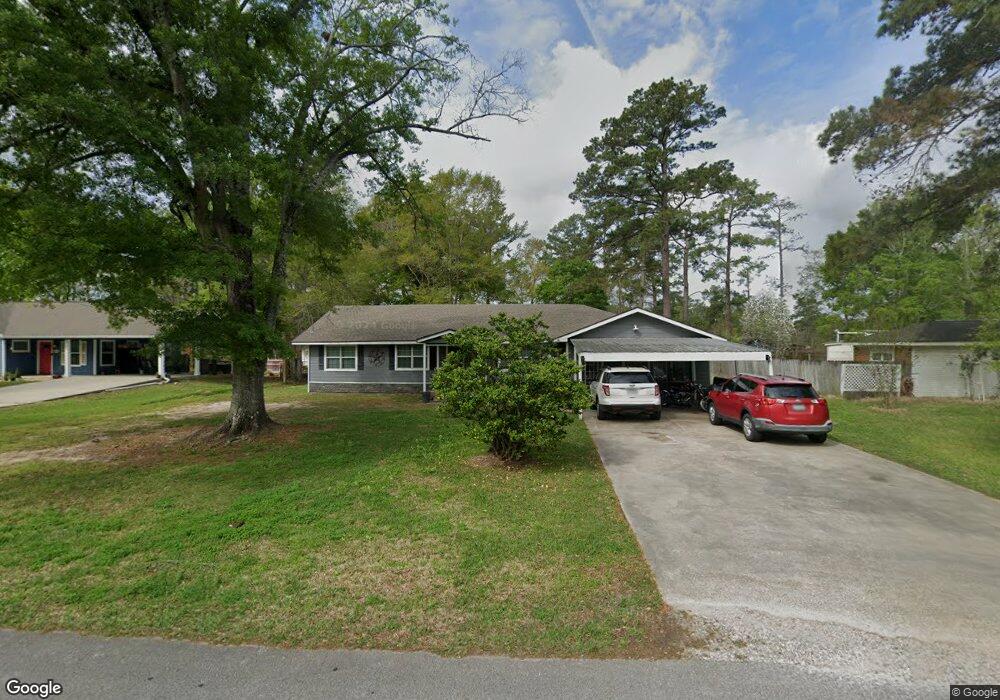
About This Home
This home is located at 140 Woodlawn St, Vidor, TX 77662 and is currently estimated at $248,989, approximately $101 per square foot. 140 Woodlawn St is a home located in Orange County with nearby schools including Faith Christian Academy.
Ownership History
Date
Name
Owned For
Owner Type
Purchase Details
Closed on
Jun 1, 2012
Sold by
Brewer Larry
Bought by
Cooper Richard E and Cooper Ruth E
Current Estimated Value
Home Financials for this Owner
Home Financials are based on the most recent Mortgage that was taken out on this home.
Original Mortgage
$55,112
Outstanding Balance
$25,053
Interest Rate
3.9%
Mortgage Type
Seller Take Back
Estimated Equity
$223,936
Purchase Details
Closed on
Mar 14, 2012
Sold by
Mitchell Richard Lee and Mitchell Bobbie Jo
Bought by
Brewer Larry
Purchase Details
Closed on
Jun 10, 2010
Sold by
Brewer Larry
Bought by
Cooper Richard E
Purchase Details
Closed on
Jun 4, 2010
Sold by
Rostrom Sandra Kaye and Estate Of Shelby Allen Rostrom
Bought by
Brewer Larry
Purchase Details
Closed on
Jan 9, 2006
Sold by
Rostrom Sandra Kaye
Bought by
Rostrom Sandra Kaye
Create a Home Valuation Report for This Property
The Home Valuation Report is an in-depth analysis detailing your home's value as well as a comparison with similar homes in the area
Home Values in the Area
Average Home Value in this Area
Purchase History
| Date | Buyer | Sale Price | Title Company |
|---|---|---|---|
| Cooper Richard E | -- | Larry Brewer | |
| Brewer Larry | -- | Larry Brewer | |
| Cooper Richard E | -- | -- | |
| Cooper Richard E | -- | -- | |
| Brewer Larry | -- | Security Abstract & Title Co | |
| Rostrom Sandra Kaye | -- | None Available |
Source: Public Records
Mortgage History
| Date | Status | Borrower | Loan Amount |
|---|---|---|---|
| Open | Cooper Richard E | $55,112 |
Source: Public Records
Tax History Compared to Growth
Tax History
| Year | Tax Paid | Tax Assessment Tax Assessment Total Assessment is a certain percentage of the fair market value that is determined by local assessors to be the total taxable value of land and additions on the property. | Land | Improvement |
|---|---|---|---|---|
| 2025 | $4,286 | $190,324 | $7,104 | $183,220 |
| 2024 | $3,572 | $189,674 | $7,104 | $182,570 |
| 2023 | $3,044 | $120,314 | $7,104 | $113,210 |
| 2022 | $3,347 | $119,774 | $7,104 | $112,670 |
| 2021 | $2,709 | $90,724 | $7,104 | $83,620 |
| 2020 | $2,355 | $77,524 | $7,104 | $70,420 |
| 2019 | $2,362 | $77,014 | $7,104 | $69,910 |
| 2018 | $1,209 | $40,384 | $7,104 | $33,280 |
| 2017 | $2,092 | $68,264 | $7,104 | $61,160 |
| 2016 | $1,930 | $63,824 | $7,104 | $56,720 |
| 2015 | $2,040 | $62,180 | $7,104 | $55,076 |
| 2014 | $2,040 | $65,225 | $7,104 | $58,121 |
Source: Public Records
Map
Nearby Homes
- 0 School Rd
- 2665 Lincoln St
- 835 Strickland St
- 1560 Posey Ln
- 285 Lakewood Dr
- 250 Oakland Dr
- 2950 Old Highway 90 E
- 235 Jennings Rd
- tbd Oakland St
- 305 Oakland Dr
- 2890 Evangeline Dr
- 605 N Lakeside St
- 18185 Ih 10
- 18046 Interstate 10
- 2950 Highway 90
- 490 Concord St Unit 485 Lexington
- 1110 S Lakeside St
- 16595 Interstate 10
- 955 Aery Rd
- 000 Hwy 1132
- 120 Woodlawn St
- 160 Woodlawn St
- 90 Woodlawn St
- 155 Woodlawn St
- 115 Woodlawn St
- 95 Woodlawn St
- 195 Woodlawn St
- 85 Woodlawn St
- 60 Woodlawn St
- 220 Woodlawn St
- 205 Woodlawn St
- 40 Woodlawn St
- 25 Woodlawn St
- 1950 Old Highway 90 E
- 250 Woodlawn St
- 160 Timber Rd
- 170 Timber Rd
- 275 Woodlawn St
- 190 Timber Rd
- 150 Timber Rd