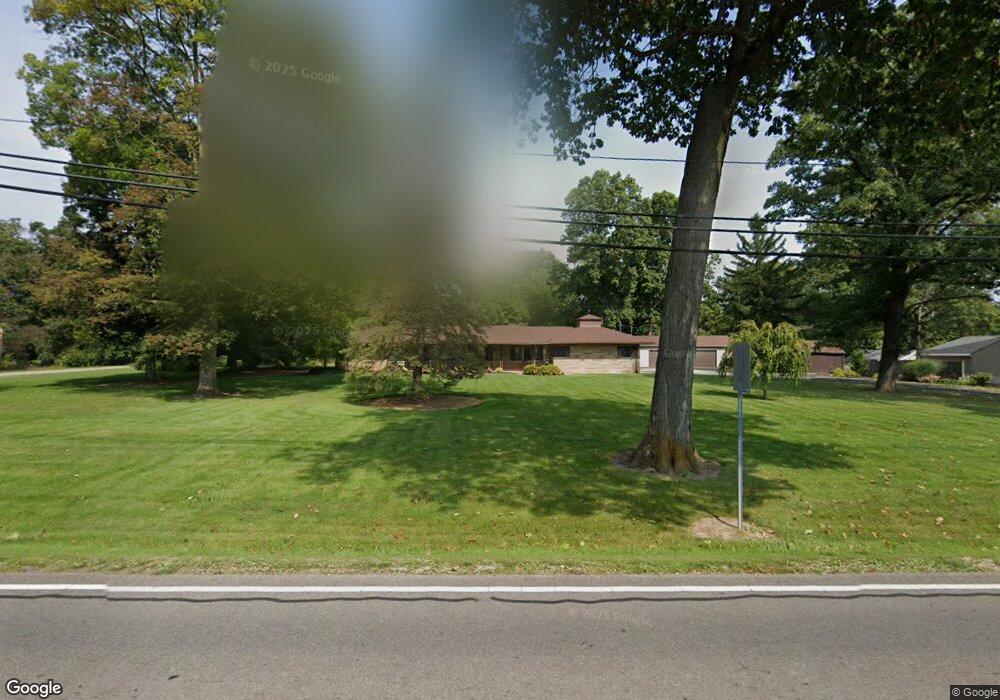
1400 Barks Rd E Marion, OH 43302
Estimated Value: $252,000 - $368,000
2
Beds
2
Baths
1,761
Sq Ft
$174/Sq Ft
Est. Value
About This Home
This home is located at 1400 Barks Rd E, Marion, OH 43302 and is currently estimated at $306,911, approximately $174 per square foot. 1400 Barks Rd E is a home located in Marion County with nearby schools including Pleasant Elementary School, Pleasant Middle School, and Pleasant High School.
Ownership History
Date
Name
Owned For
Owner Type
Purchase Details
Closed on
Aug 28, 2021
Sold by
Estate Of Clyde B Dawson
Bought by
Dawson Brenda S
Current Estimated Value
Purchase Details
Closed on
Aug 30, 2011
Sold by
Deutsche Bank National Trust Co
Bought by
Dawson Clyde B and Dawson Brenda S
Purchase Details
Closed on
Jun 23, 2011
Sold by
Ward Joshua J
Bought by
Deutsche Bank National Trust Co and Soundview Home Loan Trust
Purchase Details
Closed on
Feb 15, 2006
Sold by
Cooper James R and Cooper Mary L
Bought by
Ward Joshua J and Ward Julie M
Home Financials for this Owner
Home Financials are based on the most recent Mortgage that was taken out on this home.
Original Mortgage
$144,000
Interest Rate
14%
Mortgage Type
Adjustable Rate Mortgage/ARM
Purchase Details
Closed on
May 4, 1993
Bought by
Dawson Clyde B and Dawson Brenda S
Create a Home Valuation Report for This Property
The Home Valuation Report is an in-depth analysis detailing your home's value as well as a comparison with similar homes in the area
Home Values in the Area
Average Home Value in this Area
Purchase History
| Date | Buyer | Sale Price | Title Company |
|---|---|---|---|
| Dawson Brenda S | -- | None Available | |
| Dawson Clyde B | $81,250 | None Available | |
| Deutsche Bank National Trust Co | $121,600 | None Available | |
| Ward Joshua J | $180,000 | Barrister Title Agency Llc | |
| Dawson Clyde B | $105,000 | -- |
Source: Public Records
Mortgage History
| Date | Status | Borrower | Loan Amount |
|---|---|---|---|
| Previous Owner | Ward Joshua J | $144,000 |
Source: Public Records
Tax History
| Year | Tax Paid | Tax Assessment Tax Assessment Total Assessment is a certain percentage of the fair market value that is determined by local assessors to be the total taxable value of land and additions on the property. | Land | Improvement |
|---|---|---|---|---|
| 2025 | $3,390 | $97,890 | $18,380 | $79,510 |
| 2024 | $3,390 | $83,950 | $9,680 | $74,270 |
| 2023 | $3,390 | $83,950 | $9,680 | $74,270 |
| 2022 | $3,436 | $83,950 | $9,680 | $74,270 |
| 2021 | $2,702 | $63,340 | $7,790 | $55,550 |
| 2020 | $2,669 | $63,340 | $7,790 | $55,550 |
| 2019 | $2,778 | $63,340 | $7,790 | $55,550 |
| 2018 | $1,744 | $56,990 | $11,120 | $45,870 |
| 2017 | $1,748 | $56,990 | $11,120 | $45,870 |
| 2016 | $1,745 | $56,990 | $11,120 | $45,870 |
| 2015 | $1,762 | $55,540 | $10,580 | $44,960 |
| 2014 | $1,763 | $55,540 | $10,580 | $44,960 |
| 2012 | $1,895 | $56,420 | $10,590 | $45,830 |
Source: Public Records
Map
Nearby Homes
- 1364 Woodridge Rd
- 1378 Chaucer Ct
- 1200 Inwood Dr
- 0 Richland Rd
- 736 Eton St
- 1803 Richland Rd
- 534 Edgefield Dr
- 534 Meadow Ln
- 655 Exeter Way
- 653 Exeter Way
- 905 Villandry Dr
- 0 Barks Rd E
- 523 Normandy Dr
- 819 Laura Dr
- 1545 Center Park Dr
- 1562 Center Park Dr
- 0 University Dr
- 720 Forest Lawn Dr
- 0 Republic Way Unit 225015738
- 0 E Marion Cardington Rd Unit 9052845
- 1426 Barks Rd E
- 1196 Holliday Dr
- 1414 Willowood Way
- 1392 Willowood Way
- 1432 Willowood Way
- 1362 Barks Rd E
- 1207 Richland Rd
- 1187 Richland Rd
- 1235 Richland Rd
- 1195 Holliday Dr
- 1171 Richland Rd
- 1279 Woodridge Rd
- 1155 Richland Rd
- 1166 Holliday Dr
- 1411 Willowood Way
- 1417 Willowood Way
- 1423 Willowood Way
- 1405 Willowood Way
- 1198 Richland Rd
- 1339 Barks Rd E
Your Personal Tour Guide
Ask me questions while you tour the home.