1400 C Ave West Columbia, SC 29169
Estimated Value: $384,000 - $433,204
4
Beds
2
Baths
2,212
Sq Ft
$183/Sq Ft
Est. Value
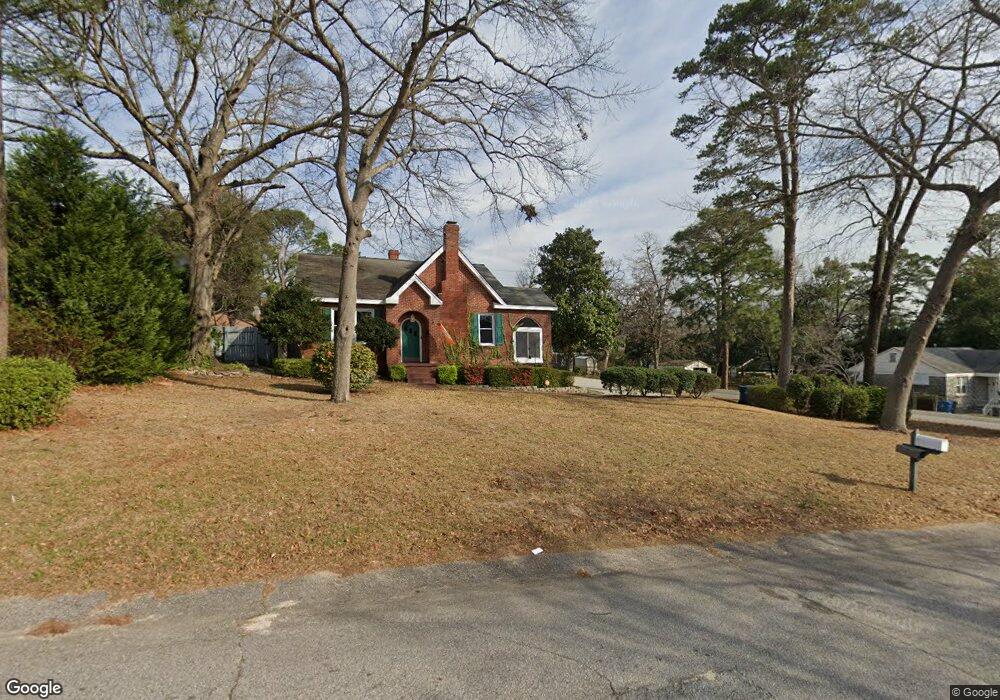
About This Home
This home is located at 1400 C Ave, West Columbia, SC 29169 and is currently estimated at $404,801, approximately $183 per square foot. 1400 C Ave is a home located in Lexington County with nearby schools including Riverbank Elementary, Cyril B. Busbee Creative Arts Academy, and Brookland-Cayce High School.
Ownership History
Date
Name
Owned For
Owner Type
Purchase Details
Closed on
Oct 27, 2023
Sold by
Giel Taylor Edward and Blackshire Emily Wray
Bought by
Harris Michael A and Harris Beverly D
Current Estimated Value
Purchase Details
Closed on
Jun 2, 2021
Sold by
Herman Steven and Herman Roselyn M
Bought by
Giel Taylor Edward and Blackshire Emily Wray
Home Financials for this Owner
Home Financials are based on the most recent Mortgage that was taken out on this home.
Original Mortgage
$232,000
Interest Rate
2.9%
Mortgage Type
New Conventional
Purchase Details
Closed on
Oct 30, 2018
Sold by
Richardson J Richard and Richardson Margaret R
Bought by
Herman Steven and Herman Roselyn M
Home Financials for this Owner
Home Financials are based on the most recent Mortgage that was taken out on this home.
Original Mortgage
$215,000
Interest Rate
4.6%
Mortgage Type
VA
Create a Home Valuation Report for This Property
The Home Valuation Report is an in-depth analysis detailing your home's value as well as a comparison with similar homes in the area
Home Values in the Area
Average Home Value in this Area
Purchase History
| Date | Buyer | Sale Price | Title Company |
|---|---|---|---|
| Harris Michael A | $400,000 | None Listed On Document | |
| Giel Taylor Edward | $290,000 | None Available | |
| Herman Steven | $215,000 | None Available |
Source: Public Records
Mortgage History
| Date | Status | Borrower | Loan Amount |
|---|---|---|---|
| Previous Owner | Giel Taylor Edward | $232,000 | |
| Previous Owner | Herman Steven | $215,000 |
Source: Public Records
Tax History Compared to Growth
Tax History
| Year | Tax Paid | Tax Assessment Tax Assessment Total Assessment is a certain percentage of the fair market value that is determined by local assessors to be the total taxable value of land and additions on the property. | Land | Improvement |
|---|---|---|---|---|
| 2024 | $3,058 | $16,000 | $2,400 | $13,600 |
| 2023 | $3,058 | $11,600 | $2,000 | $9,600 |
| 2022 | $2,238 | $11,600 | $2,000 | $9,600 |
| 2020 | $0 | $8,973 | $2,000 | $6,973 |
| 2019 | $406 | $8,600 | $1,680 | $6,920 |
| 2018 | $406 | $4,685 | $1,540 | $3,145 |
| 2017 | $379 | $4,685 | $1,540 | $3,145 |
| 2016 | $400 | $4,682 | $1,540 | $3,142 |
| 2014 | $314 | $4,877 | $1,518 | $3,359 |
| 2013 | -- | $4,880 | $1,520 | $3,360 |
Source: Public Records
Map
Nearby Homes