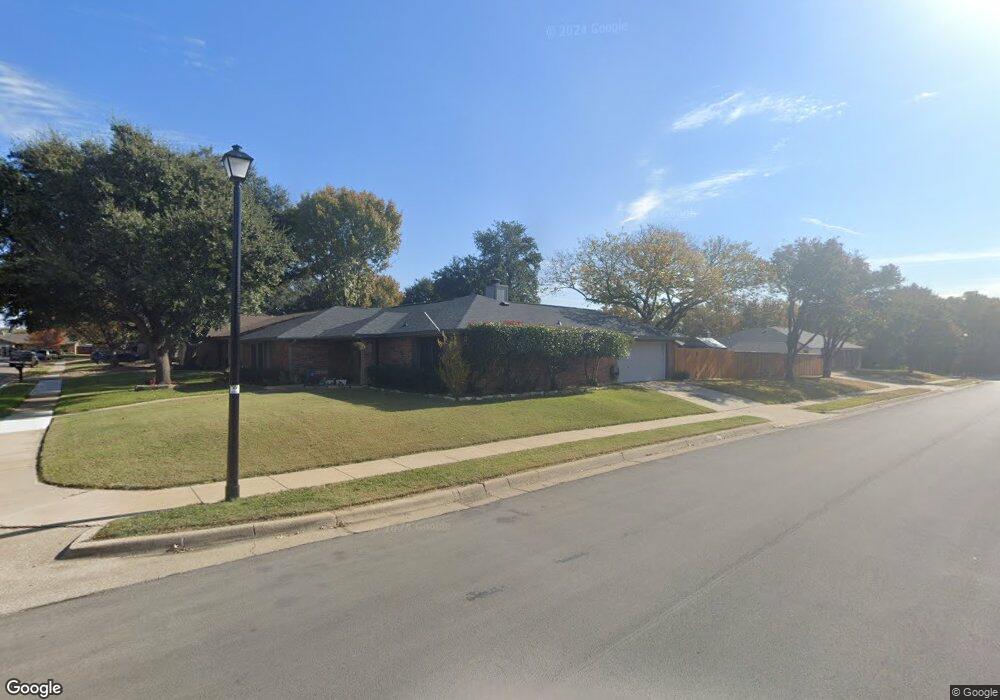
1400 Fieldstone Ct E Bedford, TX 76022
Estimated Value: $352,634 - $391,000
3
Beds
2
Baths
1,635
Sq Ft
$225/Sq Ft
Est. Value
About This Home
This home is located at 1400 Fieldstone Ct E, Bedford, TX 76022 and is currently estimated at $368,159, approximately $225 per square foot. 1400 Fieldstone Ct E is a home located in Tarrant County with nearby schools including Stonegate Elementary School, Central J High School, and L.D. Bell High School.
Ownership History
Date
Name
Owned For
Owner Type
Purchase Details
Closed on
Sep 10, 2025
Sold by
Pribble Robin Shaw and Jones Robin S
Bought by
Vaught Carolyn C
Current Estimated Value
Purchase Details
Closed on
Aug 15, 2025
Sold by
Vaught Carolyn C
Bought by
Jones Robin S and Pribble Robin Shaw
Purchase Details
Closed on
Sep 14, 1999
Sold by
Jones Robin S
Bought by
Vaught Carolyn C
Purchase Details
Closed on
Feb 23, 1998
Sold by
Jones Jack Curtis
Bought by
Jones Robin S
Purchase Details
Closed on
Aug 31, 1994
Sold by
Vaught Carolyn Combs
Bought by
Jones J Curt and Jones Robin S
Home Financials for this Owner
Home Financials are based on the most recent Mortgage that was taken out on this home.
Original Mortgage
$64,800
Interest Rate
8.52%
Purchase Details
Closed on
Sep 27, 1993
Sold by
Shaw William B and Shaw Frances E
Bought by
Vaught Carolyn Combs
Create a Home Valuation Report for This Property
The Home Valuation Report is an in-depth analysis detailing your home's value as well as a comparison with similar homes in the area
Home Values in the Area
Average Home Value in this Area
Purchase History
| Date | Buyer | Sale Price | Title Company |
|---|---|---|---|
| Vaught Carolyn C | -- | Sewell Title | |
| Jones Robin S | -- | None Listed On Document | |
| Vaught Carolyn C | -- | -- | |
| Jones Robin S | -- | -- | |
| Jones J Curt | -- | Fidelity National Title Agen | |
| Vaught Carolyn Combs | -- | -- |
Source: Public Records
Mortgage History
| Date | Status | Borrower | Loan Amount |
|---|---|---|---|
| Previous Owner | Jones J Curt | $64,800 |
Source: Public Records
Tax History Compared to Growth
Tax History
| Year | Tax Paid | Tax Assessment Tax Assessment Total Assessment is a certain percentage of the fair market value that is determined by local assessors to be the total taxable value of land and additions on the property. | Land | Improvement |
|---|---|---|---|---|
| 2025 | $4,408 | $296,000 | $70,000 | $226,000 |
| 2024 | $4,408 | $313,427 | $70,000 | $243,427 |
| 2023 | $5,056 | $328,574 | $45,000 | $283,574 |
| 2022 | $4,837 | $254,819 | $45,000 | $209,819 |
| 2021 | $4,742 | $221,382 | $45,000 | $176,382 |
| 2020 | $4,351 | $221,382 | $45,000 | $176,382 |
| 2019 | $4,042 | $225,907 | $45,000 | $180,907 |
| 2018 | $3,293 | $151,250 | $35,000 | $116,250 |
| 2017 | $3,326 | $189,110 | $35,000 | $154,110 |
| 2016 | $3,024 | $125,000 | $35,000 | $90,000 |
| 2015 | $2,615 | $115,100 | $26,000 | $89,100 |
| 2014 | $2,615 | $142,600 | $26,000 | $116,600 |
Source: Public Records
Map
Nearby Homes
- 1509 Shirley Way
- 1213 Briar Dr
- 1204 Edgecliff Dr
- 1416 Wade Dr
- 1004 Overhill Dr
- 604 Donna Ln
- 1701 Winchester Way
- 6 Park Ln
- 18 Park Ln
- 1031 Boston Blvd
- 921 Overhill Dr
- 345 Somerset Cir
- 1108 Wade Dr
- 909 Overhill Dr
- 258 Somerset Terrace
- 49 Coffee Tavern Rd
- 501 Merrill Dr
- 49 Morrow Dr
- 31 Morrow Dr
- 1236 King Dr
- 1404 Fieldstone Ct E
- 1352 Fieldstone Dr
- 1433 Circle Ln
- 1408 Fieldstone Ct E
- 1437 Circle Ln
- 1401 Fieldstone Ct E
- 1405 Fieldstone Ct E
- 1429 Circle Ln
- 1441 Circle Ln
- 1353 Fieldstone Dr
- 1348 Fieldstone Dr
- 1412 Fieldstone Ct E
- 1409 Fieldstone Ct E
- 1425 Circle Ln
- 1501 Circle Ln
- 1349 Fieldstone Dr
- 1413 Fieldstone Ct E
- 1400 Storm Ct E
- 1344 Fieldstone Dr
- 1404 Storm Ct E