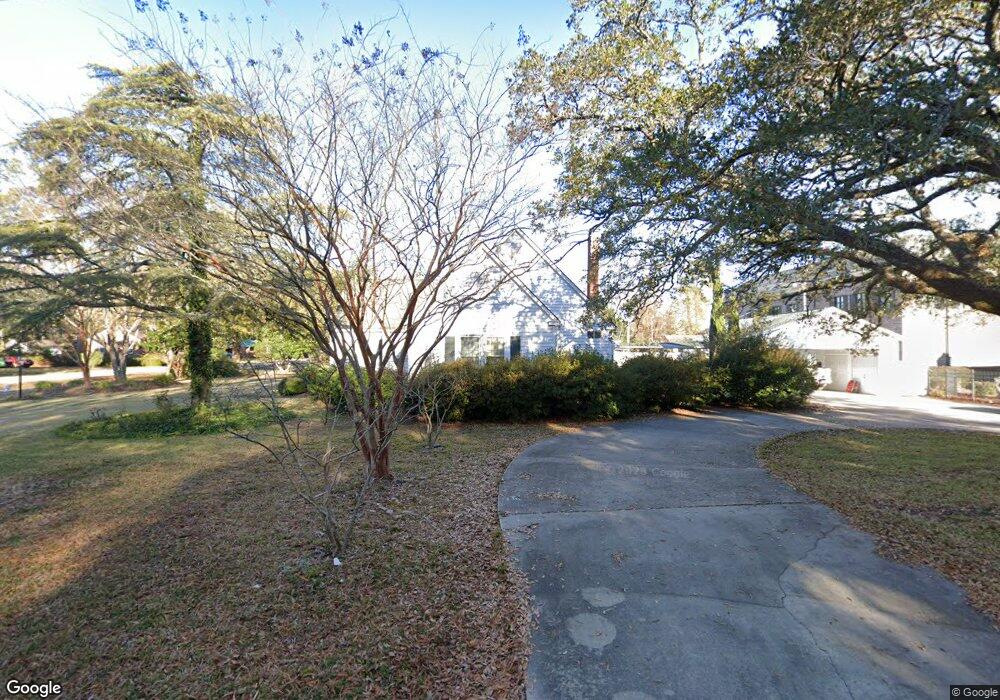
1400 Laurel St Conway, SC 29526
Estimated Value: $279,000 - $441,000
3
Beds
2
Baths
1,886
Sq Ft
$198/Sq Ft
Est. Value
About This Home
This home is located at 1400 Laurel St, Conway, SC 29526 and is currently estimated at $374,328, approximately $198 per square foot. 1400 Laurel St is a home located in Horry County with nearby schools including Conway Elementary School, Conway Middle School, and Conway High School.
Ownership History
Date
Name
Owned For
Owner Type
Purchase Details
Closed on
Dec 3, 2019
Sold by
Bunn Collins and Bunn Janice C
Bought by
Vp Investments Llc
Current Estimated Value
Home Financials for this Owner
Home Financials are based on the most recent Mortgage that was taken out on this home.
Original Mortgage
$200,000
Interest Rate
3.6%
Mortgage Type
New Conventional
Purchase Details
Closed on
Jul 1, 2013
Sold by
Forney Danielle Marie
Bought by
Johnson Dustin K
Purchase Details
Closed on
Apr 28, 2010
Sold by
Federal Home Loan Mortgage Corporation
Bought by
Forney Danielle Marie
Purchase Details
Closed on
Apr 5, 2002
Sold by
Streeter Raymond E and Streeter Barbara K
Bought by
Collins Bunn Janice C
Home Financials for this Owner
Home Financials are based on the most recent Mortgage that was taken out on this home.
Original Mortgage
$134,900
Interest Rate
6.89%
Mortgage Type
Purchase Money Mortgage
Create a Home Valuation Report for This Property
The Home Valuation Report is an in-depth analysis detailing your home's value as well as a comparison with similar homes in the area
Home Values in the Area
Average Home Value in this Area
Purchase History
| Date | Buyer | Sale Price | Title Company |
|---|---|---|---|
| Vp Investments Llc | $250,000 | -- | |
| Johnson Dustin K | $145,500 | -- | |
| Forney Danielle Marie | $134,000 | -- | |
| Collins Bunn Janice C | $149,900 | -- |
Source: Public Records
Mortgage History
| Date | Status | Borrower | Loan Amount |
|---|---|---|---|
| Closed | Vp Investments Llc | $200,000 | |
| Previous Owner | Collins Bunn Janice C | $134,900 |
Source: Public Records
Tax History Compared to Growth
Tax History
| Year | Tax Paid | Tax Assessment Tax Assessment Total Assessment is a certain percentage of the fair market value that is determined by local assessors to be the total taxable value of land and additions on the property. | Land | Improvement |
|---|---|---|---|---|
| 2024 | $4,597 | $23,491 | $10,633 | $12,858 |
| 2023 | $4,597 | $15,002 | $3,086 | $11,916 |
| 2021 | $3,960 | $15,002 | $3,086 | $11,916 |
| 2020 | $3,822 | $15,002 | $3,086 | $11,916 |
| 2019 | $472 | $19,775 | $5,400 | $14,375 |
| 2018 | $0 | $12,446 | $5,400 | $7,046 |
| 2017 | $0 | $7,112 | $3,086 | $4,026 |
| 2016 | $0 | $4,741 | $2,057 | $2,684 |
| 2015 | -- | $3,878 | $2,058 | $1,820 |
| 2014 | $259 | $3,878 | $2,058 | $1,820 |
Source: Public Records
Map
Nearby Homes
- 2831 Riverboat Way
- 708 15th Ave
- 811 17th Ave Unit 4D
- 1605 Sessions St
- 1305 Forest View Rd
- 1229 Park Hill Dr
- 1605 Mcdermott St
- 1547 Stilley Cir
- 302 Jackson Ln
- 1003 Winding Rd
- 1106 Hickory Dr
- 1704 Sherwood Dr
- 1011 Hickory Cir
- 208 Sherwood Dr
- 509 Beaty St
- 0 Mill Pond Rd Unit 2507308
- 1011 Tin Top Alley
- 1009 Tin Top Alley
- 2208 6th Ave
- 1509 Lakeland Dr
- 1400 Laurel St
- 1402 Laurel St
- 1401 14th Ave
- 1302 Laurel St
- 1404 Laurel St
- 1403 Laurel St
- 1405 Laurel St
- 1300 Laurel St
- 1401 Laurel St
- 1002 13th Ave
- 1409 Laurel St
- 1305 Laurel St
- 1500 Laurel St
- 1303 Laurel St
- 1501 Main St Unit Lot 43
- 1210 Laurel St
- 9621 U S 701 Hwy
- 6178 U S 701 Hwy
- 1915 N Main St Unit Corner of Main St an
- .50 ac N Main St