Estimated Value: $319,772 - $404,000
3
Beds
2
Baths
1,484
Sq Ft
$243/Sq Ft
Est. Value
About This Home
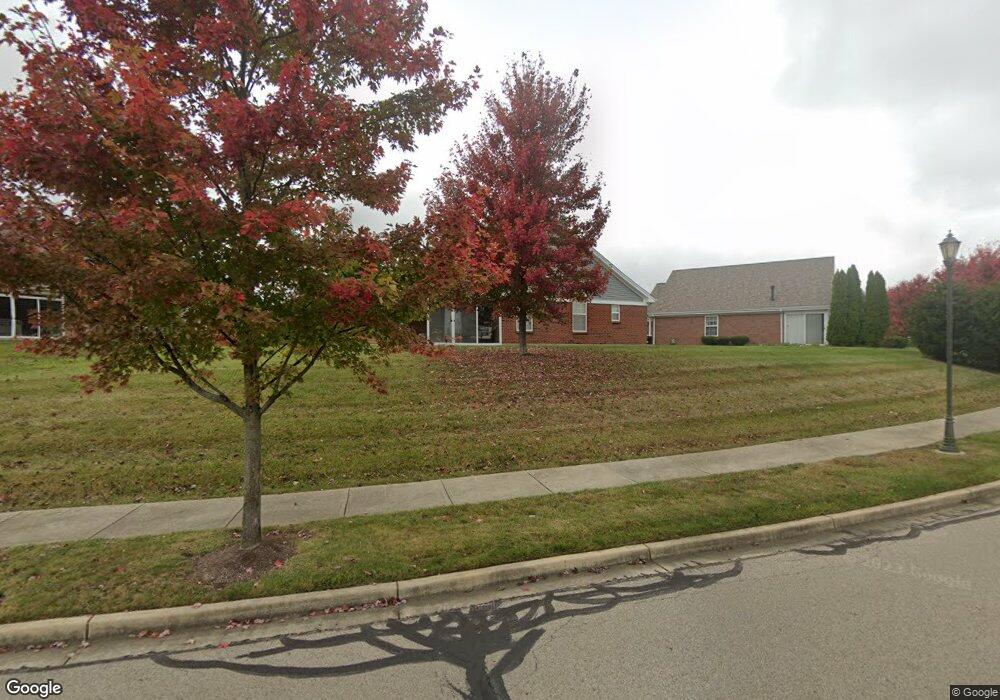
This home is located at 1400 Runnymeade Way, Xenia, OH 45385 and is currently estimated at $360,693, approximately $243 per square foot. 1400 Runnymeade Way is a home located in Greene County with nearby schools including Trebein Elementary School, Jacob Coy Middle School, and Beavercreek High School.
Ownership History
Date
Name
Owned For
Owner Type
Purchase Details
Closed on
Nov 10, 2006
Sold by
Willis Matthew Douglas and Willis Michele L
Bought by
Willis Matthew D and Willis Michele L
Current Estimated Value
Purchase Details
Closed on
Nov 19, 2004
Sold by
Simms Sc Ltd
Bought by
Willis Matthew Douglas
Home Financials for this Owner
Home Financials are based on the most recent Mortgage that was taken out on this home.
Original Mortgage
$165,500
Outstanding Balance
$82,204
Interest Rate
5.71%
Mortgage Type
Unknown
Estimated Equity
$278,489
Purchase Details
Closed on
Jun 16, 2004
Sold by
Stonehill Development Ltd
Bought by
Simms Sc Ltd
Home Financials for this Owner
Home Financials are based on the most recent Mortgage that was taken out on this home.
Original Mortgage
$156,400
Interest Rate
6.37%
Mortgage Type
Construction
Create a Home Valuation Report for This Property
The Home Valuation Report is an in-depth analysis detailing your home's value as well as a comparison with similar homes in the area
Home Values in the Area
Average Home Value in this Area
Purchase History
| Date | Buyer | Sale Price | Title Company |
|---|---|---|---|
| Willis Matthew D | -- | Attorney | |
| Willis Matthew Douglas | $206,900 | -- | |
| Simms Sc Ltd | $198,200 | -- |
Source: Public Records
Mortgage History
| Date | Status | Borrower | Loan Amount |
|---|---|---|---|
| Open | Willis Matthew Douglas | $165,500 | |
| Previous Owner | Simms Sc Ltd | $156,400 | |
| Closed | Willis Matthew Douglas | $20,600 |
Source: Public Records
Tax History Compared to Growth
Tax History
| Year | Tax Paid | Tax Assessment Tax Assessment Total Assessment is a certain percentage of the fair market value that is determined by local assessors to be the total taxable value of land and additions on the property. | Land | Improvement |
|---|---|---|---|---|
| 2024 | $4,934 | $87,720 | $19,850 | $67,870 |
| 2023 | $4,934 | $87,720 | $19,850 | $67,870 |
| 2022 | $4,425 | $68,970 | $19,850 | $49,120 |
| 2021 | $4,470 | $68,970 | $19,850 | $49,120 |
| 2020 | $4,491 | $68,970 | $19,850 | $49,120 |
| 2019 | $4,327 | $61,010 | $17,140 | $43,870 |
| 2018 | $3,771 | $61,010 | $17,140 | $43,870 |
| 2017 | $3,743 | $61,010 | $17,140 | $43,870 |
| 2016 | $3,691 | $58,930 | $17,140 | $41,790 |
| 2015 | $3,714 | $58,930 | $17,140 | $41,790 |
| 2014 | $3,627 | $58,930 | $17,140 | $41,790 |
Source: Public Records
Map
Nearby Homes
- 1462 Champions Way
- 1382 Prestonwood Ct S
- 1247 Homestead Dr
- Torino II Plan at The Courtyards at Stonehill Village
- Palazzo Plan at The Courtyards at Stonehill Village
- Promenade III Plan at The Courtyards at Stonehill Village
- Portico Plan at The Courtyards at Stonehill Village
- Verona Plan at The Courtyards at Stonehill Village
- 1427 Triple Crown Way
- 1590 Windham Ln
- 1589 Stonebury Ct
- 1121 Westover Rd
- 1678 Fairground Rd
- 1416 Hilltop Rd
- 1238 Freedom Point
- 1481 Stone Ridge Ct
- 2073 Lincolnshire Dr
- 1535 Stretch Dr
- 2162 Sulky Trail
- 2331 Eastwind Dr
- 1404 Runnymeade Way
- 1396 Runnymeade Way
- 1408 Runnymeade Way
- 1373 Champions Way
- 1399 Runnymeade Way
- 1370 Champions Way
- 1412 Runnymeade Way
- 1415 Champions Way
- 1409 Champions Way
- 1425 Champions Way
- 1401 Runnymeade Way
- 1435 Champions Way
- 1387 Champions Way
- 1405 Runnymeade Way
- 1416 Runnymeade Way
- 1420 Abbey Park Place
- 1439 Champions Way
- 1374 Champions Way
- 1409 Runnymeade Way
- 1413 Runnymeade Way