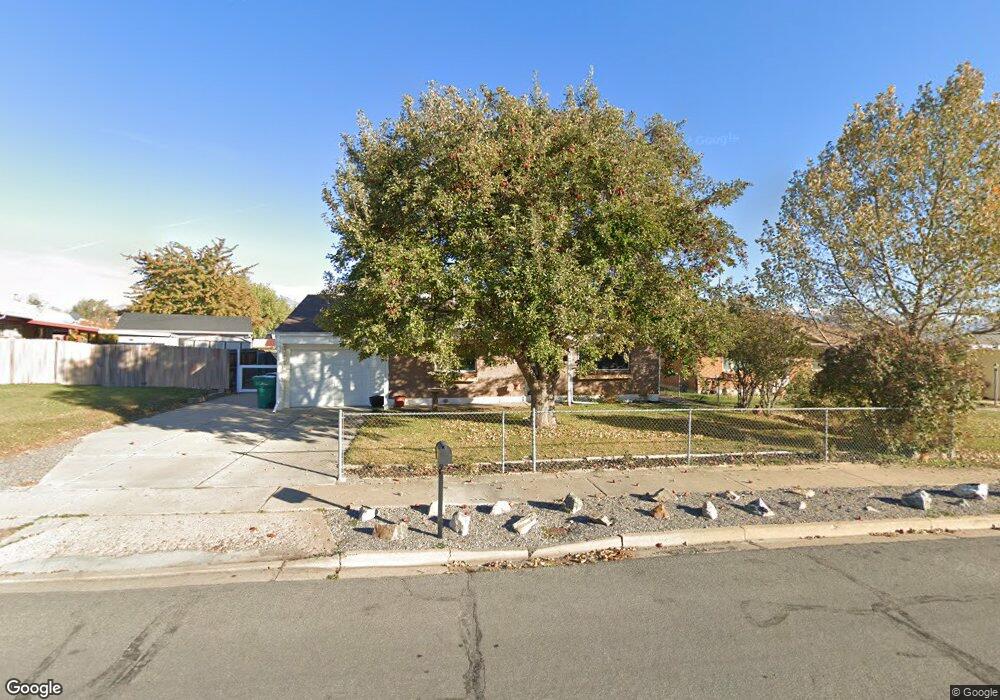
1400 Sherma Ave Layton, UT 84041
Estimated Value: $394,000 - $449,000
3
Beds
1
Bath
1,362
Sq Ft
$302/Sq Ft
Est. Value
About This Home
This home is located at 1400 Sherma Ave, Layton, UT 84041 and is currently estimated at $410,724, approximately $301 per square foot. 1400 Sherma Ave is a home located in Davis County with nearby schools including Vae View Elementary School, Central Davis Junior High School, and Layton High School.
Ownership History
Date
Name
Owned For
Owner Type
Purchase Details
Closed on
Feb 5, 2026
Sold by
Lambros Ellen
Bought by
Ellen Lambros Revocable Living Trust and Lambros
Current Estimated Value
Purchase Details
Closed on
Sep 11, 2019
Sold by
Cowdray Meghan
Bought by
Lambros Ellen
Home Financials for this Owner
Home Financials are based on the most recent Mortgage that was taken out on this home.
Original Mortgage
$223,779
Interest Rate
3.6%
Mortgage Type
New Conventional
Purchase Details
Closed on
Jan 31, 2011
Sold by
Lintner Elizabeth
Bought by
Lintner Elizabeth and John J & Esther A Martinez Joint Living
Home Financials for this Owner
Home Financials are based on the most recent Mortgage that was taken out on this home.
Original Mortgage
$195,000
Interest Rate
4.79%
Mortgage Type
Reverse Mortgage Home Equity Conversion Mortgage
Purchase Details
Closed on
Apr 1, 2000
Sold by
Martinez John J and Martinez Esther A
Bought by
Martinez John and Martinez Esther
Create a Home Valuation Report for This Property
The Home Valuation Report is an in-depth analysis detailing your home's value as well as a comparison with similar homes in the area
Home Values in the Area
Average Home Value in this Area
Purchase History
| Date | Buyer | Sale Price | Title Company |
|---|---|---|---|
| Ellen Lambros Revocable Living Trust | -- | None Listed On Document | |
| Lambros Ellen | -- | Old Republic Natl Title Ins | |
| Lintner Elizabeth | -- | Meridian Title Company | |
| Martinez John | -- | -- |
Source: Public Records
Mortgage History
| Date | Status | Borrower | Loan Amount |
|---|---|---|---|
| Previous Owner | Lambros Ellen | $223,779 | |
| Previous Owner | Lintner Elizabeth | $195,000 |
Source: Public Records
Tax History
| Year | Tax Paid | Tax Assessment Tax Assessment Total Assessment is a certain percentage of the fair market value that is determined by local assessors to be the total taxable value of land and additions on the property. | Land | Improvement |
|---|---|---|---|---|
| 2025 | $2,007 | $210,650 | $101,220 | $109,430 |
| 2024 | $1,945 | $205,700 | $120,912 | $84,788 |
| 2023 | $1,883 | $351,000 | $159,270 | $191,730 |
| 2022 | $1,989 | $201,300 | $74,266 | $127,034 |
| 2021 | $1,802 | $272,000 | $105,059 | $166,941 |
| 2020 | $1,602 | $232,000 | $77,048 | $154,952 |
| 2019 | $1,368 | $194,000 | $74,086 | $119,914 |
| 2018 | $1,187 | $169,000 | $68,599 | $100,401 |
| 2016 | $978 | $71,831 | $19,850 | $51,981 |
| 2015 | $922 | $64,296 | $19,850 | $44,446 |
| 2014 | $1,005 | $71,642 | $19,850 | $51,792 |
| 2013 | -- | $64,539 | $19,646 | $44,893 |
Source: Public Records
Map
Nearby Homes
- 1353 N Celia Way
- 2600 N Hill Rd Unit 19
- 1358 Marilyn Dr
- 1235 N 1875 W Unit 214
- 1235 N 1875 W
- 1227 N 1875 W
- 1227 N 1875 W Unit 213
- 1652 N 1600 St W
- 1211 N 1875 W Unit 211
- 1211 N 1875 W
- 1658 N 1600 St W Unit 130
- 1664 N 1600 W
- 1650 N Main St Unit 126
- 1682 N 1600 W
- 1688 N 1600 W
- 1696 N 1600 W Unit 123
- 1707 N 1625 W
- 1713 N 1625 W
- 1451 N 1875 W Unit 168
- 1717 N 1625 W
- 1390 Sherma Ave
- 1450 Sherma Ave
- 1484 Sherma Ave
- 1376 Sherma Ave
- 1387 Everette St
- 1448 Sherma Ave
- 1377 Everette St
- 1522 Sherma Ave
- 1405 Sherma Ave
- 1391 Sherma Ave
- 1366 Sherma Ave
- 1417 Sherma Ave
- 1399 Everette St
- 1363 Everette St
- 1379 Sherma Ave
- 1427 Everette St
- 1427 Sherma Ave
- 1437 Everette St
- 1365 Sherma Ave
- 1457 Sherma Ave
Your Personal Tour Guide
Ask me questions while you tour the home.