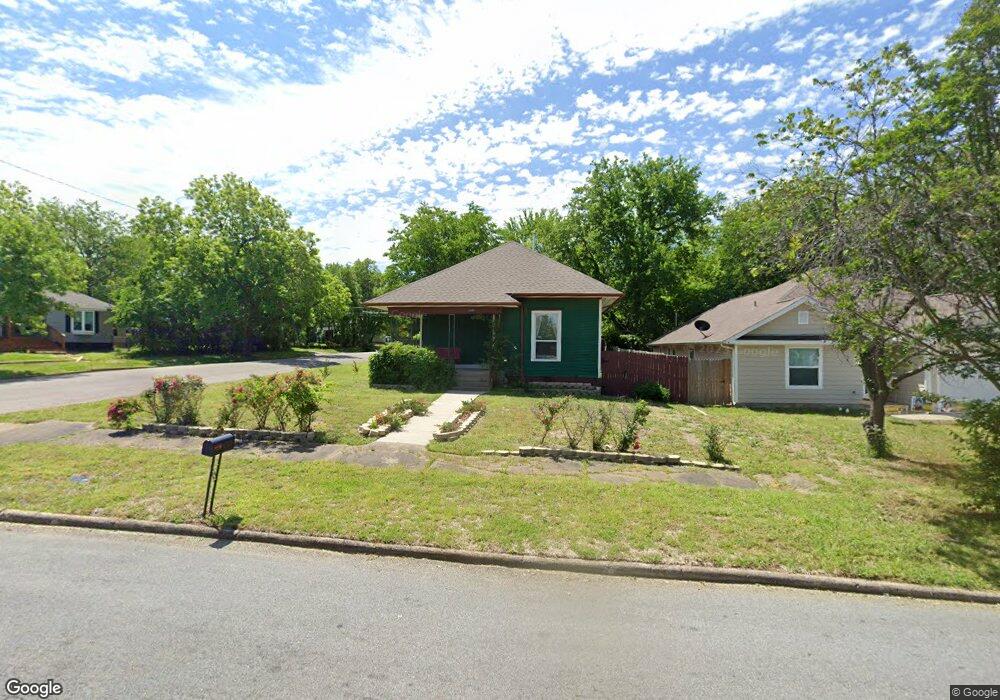
1400 W Sears St Denison, TX 75020
Estimated Value: $143,159 - $181,000
--
Bed
--
Bath
984
Sq Ft
$165/Sq Ft
Est. Value
About This Home
This home is located at 1400 W Sears St, Denison, TX 75020 and is currently estimated at $162,080, approximately $164 per square foot. 1400 W Sears St is a home located in Grayson County with nearby schools including Mayes Elementary School, Scott Middle School, and Denison High School.
Ownership History
Date
Name
Owned For
Owner Type
Purchase Details
Closed on
Sep 29, 2023
Sold by
Klinko Hunter
Bought by
Garcia Noelle Janina and Garcia Rafael Stefano
Current Estimated Value
Home Financials for this Owner
Home Financials are based on the most recent Mortgage that was taken out on this home.
Original Mortgage
$116,870
Outstanding Balance
$114,559
Interest Rate
7.09%
Mortgage Type
New Conventional
Estimated Equity
$47,521
Purchase Details
Closed on
Nov 18, 2020
Sold by
Gray James Paul and Gray Joycelynn
Bought by
Klinko Hunter
Purchase Details
Closed on
Jun 16, 2004
Sold by
Burgin J L and Burgin Sylvia
Bought by
Gray James Paul and Gray Joycelynn
Home Financials for this Owner
Home Financials are based on the most recent Mortgage that was taken out on this home.
Original Mortgage
$24,000
Interest Rate
6.12%
Mortgage Type
Seller Take Back
Purchase Details
Closed on
Mar 25, 2004
Sold by
Wortham Ted D and Shipman Don M
Bought by
Burgin J L and Burgin Sylvia
Create a Home Valuation Report for This Property
The Home Valuation Report is an in-depth analysis detailing your home's value as well as a comparison with similar homes in the area
Home Values in the Area
Average Home Value in this Area
Purchase History
| Date | Buyer | Sale Price | Title Company |
|---|---|---|---|
| Garcia Noelle Janina | -- | Chapin Title Company | |
| Klinko Hunter | -- | None Available | |
| Gray James Paul | -- | -- | |
| Burgin J L | -- | -- |
Source: Public Records
Mortgage History
| Date | Status | Borrower | Loan Amount |
|---|---|---|---|
| Open | Garcia Noelle Janina | $116,870 | |
| Previous Owner | Gray James Paul | $24,000 |
Source: Public Records
Tax History Compared to Growth
Tax History
| Year | Tax Paid | Tax Assessment Tax Assessment Total Assessment is a certain percentage of the fair market value that is determined by local assessors to be the total taxable value of land and additions on the property. | Land | Improvement |
|---|---|---|---|---|
| 2025 | $3,083 | $127,794 | $43,125 | $84,669 |
| 2024 | $3,083 | $132,681 | $47,250 | $85,431 |
| 2023 | $2,841 | $125,411 | $40,875 | $84,536 |
| 2022 | $2,358 | $99,258 | $40,875 | $58,383 |
| 2021 | $1,683 | $66,720 | $20,250 | $46,470 |
| 2020 | $1,366 | $64,701 | $15,000 | $49,701 |
| 2019 | $1,296 | $66,929 | $12,450 | $54,479 |
| 2018 | $1,187 | $42,800 | $7,800 | $35,000 |
| 2017 | $1,109 | $39,658 | $6,975 | $32,683 |
| 2016 | $1,062 | $37,972 | $4,200 | $33,772 |
| 2015 | $616 | $36,354 | $5,250 | $31,104 |
| 2014 | $766 | $36,354 | $5,250 | $31,104 |
Source: Public Records
Map
Nearby Homes
- 1320 W Morton St
- 1315 W Gandy St
- 1309 W Morton St
- 1208 W Sears St
- 1200 W Gandy St
- 3030 W Morton St
- 1700 W Morton St
- 3300 W Morton St
- 1123 W Sears St
- 2900 W Morton St
- 3130 W Morton St
- 1230 W Woodard St
- 1111 W Sears St
- 108 N Eddy Ave
- 1231 W Main St
- 1601 W Bond St
- 1104 W Bond St
- 1609 W Woodard St
- 1114 W Walker St
- 1031 W Gandy St
- 1406 W Sears St
- 759 N Eddy Ave
- 755 N Eddy Ave
- 751 N Eddy Ave
- 1410 W Sears St
- 1330 W Sears St
- 1414 W Sears St
- 1401 W Gandy St
- 1326 W Sears St
- 1405 W Gandy St
- 1418 W Sears St
- 1331 W Gandy St
- 1322 W Sears St
- 1411 W Gandy St
- 1401 W Sears St
- 1411 W Sears St
- 1422 W Sears St
- 1331 W Sears St
- 1417 W Gandy St
- 1327 W Gandy St