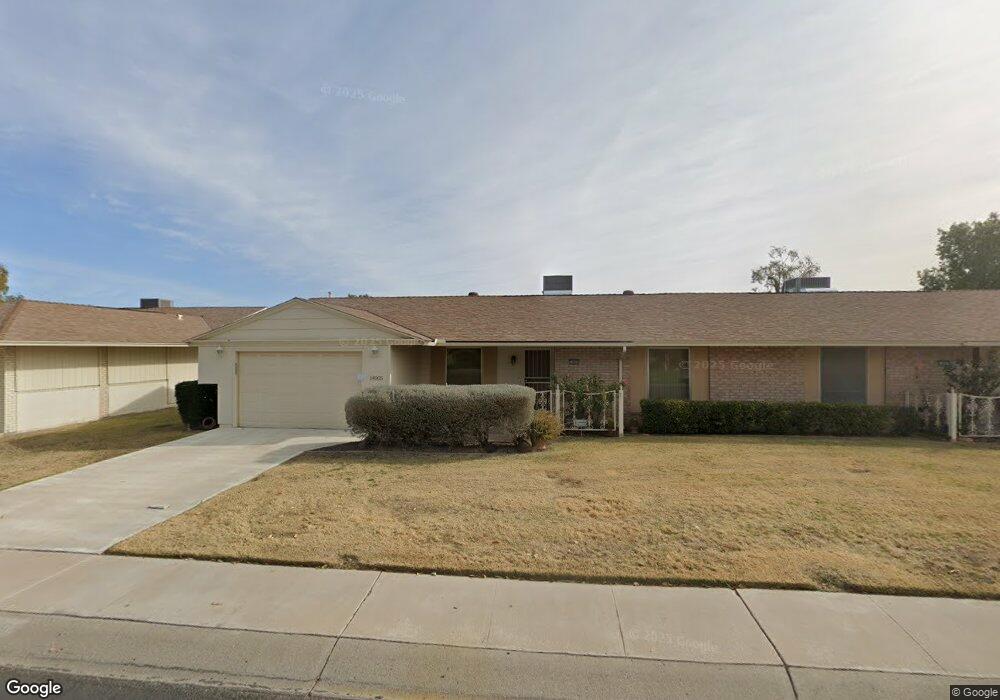
14005 N Tumblebrook Way Sun City, AZ 85351
Estimated Value: $186,682 - $232,000
--
Bed
2
Baths
1,125
Sq Ft
$193/Sq Ft
Est. Value
About This Home
This home is located at 14005 N Tumblebrook Way, Sun City, AZ 85351 and is currently estimated at $216,671, approximately $192 per square foot. 14005 N Tumblebrook Way is a home located in Maricopa County with nearby schools including Ombudsman - Northwest Charter and Arrowhead Montessori.
Ownership History
Date
Name
Owned For
Owner Type
Purchase Details
Closed on
Jun 26, 2018
Sold by
Kruegel John M and The Dean L Kruegel And Marcele
Bought by
Rios Sandra K
Current Estimated Value
Purchase Details
Closed on
May 11, 1998
Sold by
Degraff Bernard J and Degraff Katherine H
Bought by
Kruegel Dean L and Kruegel Marcelene A
Purchase Details
Closed on
Mar 19, 1998
Sold by
Dressler Archie Lee and Dressler Melba
Bought by
Degraff Bernard J and Degraff Katherine H
Purchase Details
Closed on
Jan 9, 1995
Sold by
Nesbitt Joe Allen and Nesbitt Audrey A
Bought by
Dressler Archie L and Dressler Melba
Home Financials for this Owner
Home Financials are based on the most recent Mortgage that was taken out on this home.
Original Mortgage
$58,800
Interest Rate
8.75%
Mortgage Type
New Conventional
Create a Home Valuation Report for This Property
The Home Valuation Report is an in-depth analysis detailing your home's value as well as a comparison with similar homes in the area
Home Values in the Area
Average Home Value in this Area
Purchase History
| Date | Buyer | Sale Price | Title Company |
|---|---|---|---|
| Rios Sandra K | $94,800 | None Available | |
| Rios Sandra K | -- | None Available | |
| Kruegel Dean L | $82,500 | Ati Title Agency | |
| Degraff Bernard J | $70,000 | Ati Title Agency | |
| Dressler Archie L | $73,500 | United Title Agency |
Source: Public Records
Mortgage History
| Date | Status | Borrower | Loan Amount |
|---|---|---|---|
| Previous Owner | Dressler Archie L | $58,800 |
Source: Public Records
Tax History Compared to Growth
Tax History
| Year | Tax Paid | Tax Assessment Tax Assessment Total Assessment is a certain percentage of the fair market value that is determined by local assessors to be the total taxable value of land and additions on the property. | Land | Improvement |
|---|---|---|---|---|
| 2025 | $706 | $7,970 | -- | -- |
| 2024 | $640 | $7,591 | -- | -- |
| 2023 | $640 | $15,710 | $3,140 | $12,570 |
| 2022 | $605 | $13,310 | $2,660 | $10,650 |
| 2021 | $619 | $11,830 | $2,360 | $9,470 |
| 2020 | $604 | $10,330 | $2,060 | $8,270 |
| 2019 | $595 | $9,560 | $1,910 | $7,650 |
| 2018 | $574 | $8,300 | $1,660 | $6,640 |
| 2017 | $555 | $7,120 | $1,420 | $5,700 |
| 2016 | $315 | $5,750 | $1,150 | $4,600 |
| 2015 | $498 | $5,310 | $1,060 | $4,250 |
Source: Public Records
Map
Nearby Homes
- 13720 N 98th Ave Unit A
- 14202 N Lakeforest Dr
- 9961 W Bolivar Dr
- 13622 N 98th Ave Unit D
- 10050 W Lancaster Dr
- 13608 N 98th Ave Unit Q
- 9971 W Bolivar Dr
- 13232 N 98th Ave Unit G
- 13232 N 98th Ave Unit K
- 13709 N 98th Ave Unit B
- 9917 W Shiprock Dr
- 13611 N 98th Ave Unit D
- 10072 W Lancaster Dr Unit 24B
- 10038 W Lancaster Dr
- 9969 W Cameo Dr
- 13621 N 98th Ave Unit H
- 9935 W Thunderbird Blvd
- 14409 N Mcphee Dr Unit 21A
- 13233 N 99th Dr Unit 24B
- 9519 W Timberline Dr
- 14001 N Tumblebrook Way Unit 291
- 14011 N Tumblebrook Way Unit 293
- 14015 N Tumblebrook Way Unit 20
- 13851 N Tumblebrook Way Unit 290
- 14012 N Tumblebrook Way
- 13847 N Tumblebrook Way
- 14002 N Tumblebrook Way
- 14021 N Tumblebrook Way
- 14016 N Tumblebrook Way
- 13850 N Tumblebrook Way
- 14025 N Tumblebrook Way
- 14022 N Tumblebrook Way
- 13846 N Tumblebrook Way
- 13845 N Tumblebrook Way
- 14001 N 99th Dr Unit 20
- 14014 N Lakeforest Dr
- 14005 N 99th Dr Unit 260
- 14026 N Tumblebrook Way
- 14008 N Lakeforest Dr
- 13857 N 99th Dr