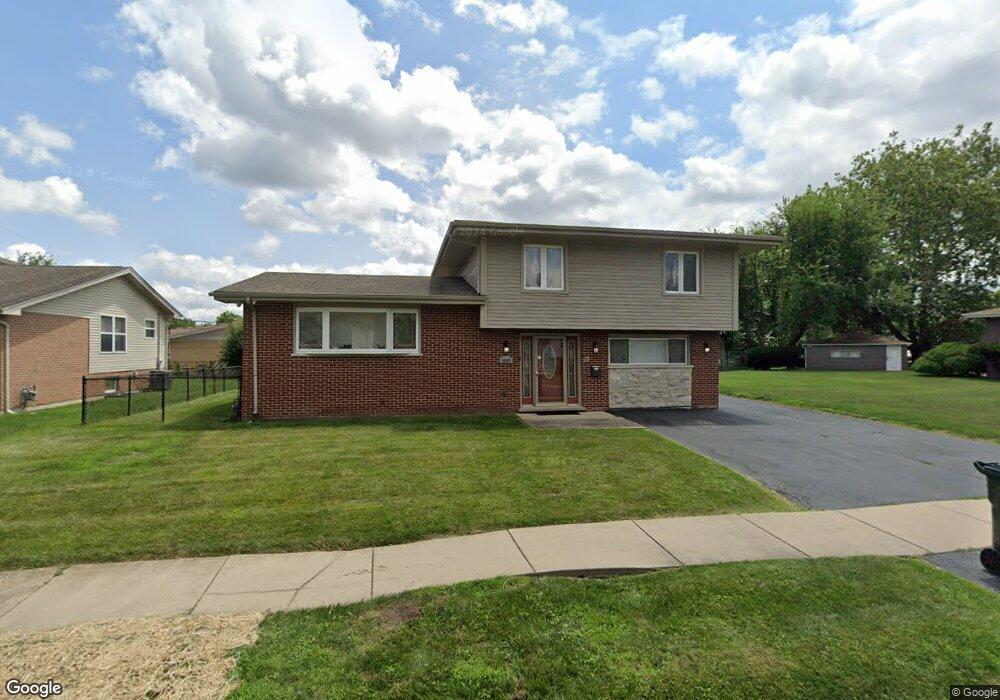
14009 S Wayman Ln Robbins, IL 60472
Estimated Value: $193,000 - $267,000
3
Beds
2
Baths
1,278
Sq Ft
$171/Sq Ft
Est. Value
About This Home
This home is located at 14009 S Wayman Ln, Robbins, IL 60472 and is currently estimated at $219,026, approximately $171 per square foot. 14009 S Wayman Ln is a home located in Cook County with nearby schools including Delia M. Turner Elementary School, Posen Intermediate School, and Thomas J. Kellar Middle School.
Ownership History
Date
Name
Owned For
Owner Type
Purchase Details
Closed on
Jun 28, 2012
Sold by
Zagraniczny Casey
Bought by
Hudson Antoinette
Current Estimated Value
Home Financials for this Owner
Home Financials are based on the most recent Mortgage that was taken out on this home.
Original Mortgage
$94,031
Outstanding Balance
$65,215
Interest Rate
3.77%
Mortgage Type
FHA
Estimated Equity
$153,811
Purchase Details
Closed on
Apr 24, 2009
Sold by
Fannie Mae
Bought by
Zagraniczny Casey
Purchase Details
Closed on
Jul 29, 2008
Sold by
Williams Roscoe
Bought by
Federal National Mortgage Association
Purchase Details
Closed on
Oct 27, 1994
Sold by
Huntington Natl Bank Of Indiana
Bought by
Miller Zetta
Purchase Details
Closed on
Dec 7, 1982
Sold by
Miller Zetta
Bought by
Miller Zetta and Miller Selma
Create a Home Valuation Report for This Property
The Home Valuation Report is an in-depth analysis detailing your home's value as well as a comparison with similar homes in the area
Home Values in the Area
Average Home Value in this Area
Purchase History
| Date | Buyer | Sale Price | Title Company |
|---|---|---|---|
| Hudson Antoinette | $98,000 | Fidelity National Title | |
| Zagraniczny Casey | $22,000 | First American | |
| Federal National Mortgage Association | -- | None Available | |
| Miller Zetta | $4,000 | -- | |
| Miller Zetta | -- | Stewart Title |
Source: Public Records
Mortgage History
| Date | Status | Borrower | Loan Amount |
|---|---|---|---|
| Open | Hudson Antoinette | $94,031 |
Source: Public Records
Tax History Compared to Growth
Tax History
| Year | Tax Paid | Tax Assessment Tax Assessment Total Assessment is a certain percentage of the fair market value that is determined by local assessors to be the total taxable value of land and additions on the property. | Land | Improvement |
|---|---|---|---|---|
| 2024 | $6,447 | $17,500 | $1,496 | $16,004 |
| 2023 | $6,225 | $17,500 | $1,496 | $16,004 |
| 2022 | $6,225 | $13,269 | $1,330 | $11,939 |
| 2021 | $5,872 | $13,268 | $1,330 | $11,938 |
| 2020 | $5,704 | $13,268 | $1,330 | $11,938 |
| 2019 | $4,833 | $10,776 | $1,163 | $9,613 |
| 2018 | $4,630 | $10,776 | $1,163 | $9,613 |
| 2017 | $4,722 | $10,776 | $1,163 | $9,613 |
| 2016 | $3,636 | $8,192 | $997 | $7,195 |
| 2015 | $3,623 | $8,192 | $997 | $7,195 |
| 2014 | $3,580 | $8,192 | $997 | $7,195 |
| 2013 | $4,146 | $10,420 | $997 | $9,423 |
Source: Public Records
Map
Nearby Homes
- 13834 Turner Ave
- 3131 141st Place
- 16215 S Trumbull Ave
- 3127 141st Place
- 3226 W Lydia Ave
- 14044 S Grace Ave
- 3722 W 139th Place
- 14039 S Claire Blvd
- 14110 S Grace Ave
- 3636 W 139th Place
- 3415 W 136th Place
- 13621 S Homan Ave
- 14104 S Claire Blvd
- 3535 W 137th St
- 14110 S Claire Blvd
- 13908 Central Park Ave
- 3738 W 141st St
- 3730 W 140th Place
- 3743 W 140th St
- 3745 W 140th St
- 14005 S Wayman Ln
- 13932 S Richardson Ave
- 13924 S Richardson Ave
- 14017 S Wayman Ln
- 13936 S Richardson Ave
- 14001 S Wayman Ln
- 14012 S Wayman Ln
- 14008 S Wayman Ln
- 14014 S Wayman Ln
- 14004 S Wayman Ln
- 14021 S Wayman Ln
- 14003 S Wayman Ln
- 13940 S Richardson Ave
- 14018 S Wayman Ln
- 14000 S Wayman Ln
- 14025 S Wayman Ln
- 14015 S Lydia Ave
- 13929 S Richardson Ave
- 14011 S Lydia Ave
- 13933 S Richardson Ave