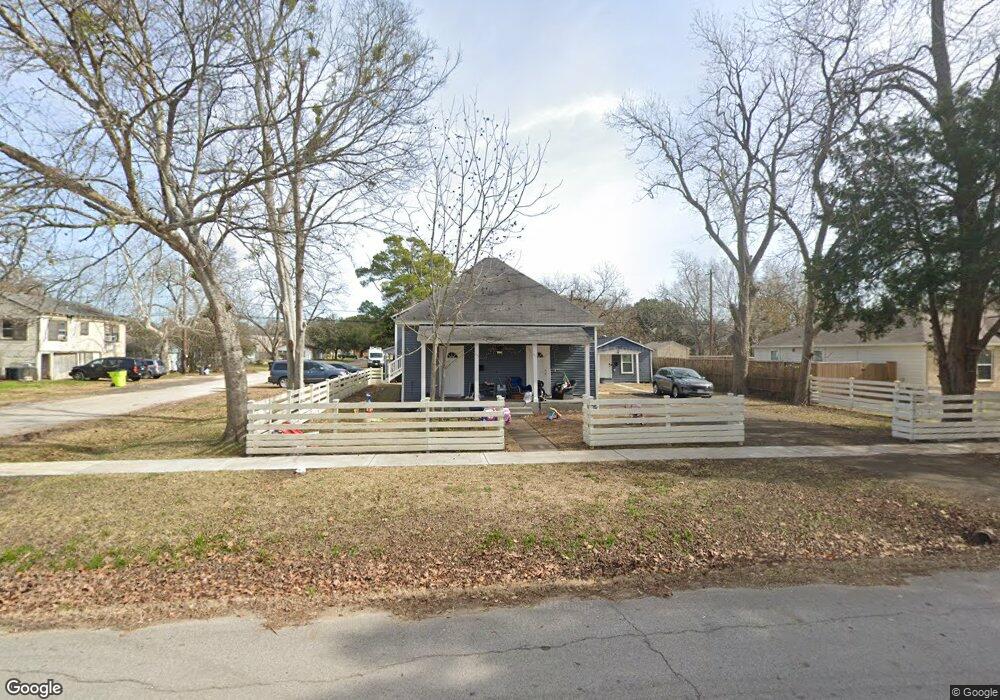
1401 5th St Rosenberg, TX 77471
Estimated Value: $562,972 - $636,000
2
Beds
1
Bath
1,120
Sq Ft
$535/Sq Ft
Est. Value
About This Home
This home is located at 1401 5th St, Rosenberg, TX 77471 and is currently estimated at $599,486, approximately $535 per square foot. 1401 5th St is a home located in Fort Bend County with nearby schools including Taylor Ray Elementary School, George Junior High School, and B.F. Terry High School.
Ownership History
Date
Name
Owned For
Owner Type
Purchase Details
Closed on
Jun 30, 2023
Sold by
Ridi International Llc
Bought by
Nelson James Mike
Current Estimated Value
Home Financials for this Owner
Home Financials are based on the most recent Mortgage that was taken out on this home.
Original Mortgage
$565,567
Outstanding Balance
$549,702
Interest Rate
6.75%
Mortgage Type
FHA
Estimated Equity
$49,784
Create a Home Valuation Report for This Property
The Home Valuation Report is an in-depth analysis detailing your home's value as well as a comparison with similar homes in the area
Home Values in the Area
Average Home Value in this Area
Purchase History
| Date | Buyer | Sale Price | Title Company |
|---|---|---|---|
| Nelson James Mike | -- | None Listed On Document |
Source: Public Records
Mortgage History
| Date | Status | Borrower | Loan Amount |
|---|---|---|---|
| Open | Nelson James Mike | $565,567 |
Source: Public Records
Tax History
| Year | Tax Paid | Tax Assessment Tax Assessment Total Assessment is a certain percentage of the fair market value that is determined by local assessors to be the total taxable value of land and additions on the property. | Land | Improvement |
|---|---|---|---|---|
| 2025 | $5,548 | $345,196 | $55,401 | $289,795 |
| 2024 | $5,548 | $293,730 | $55,401 | $238,329 |
| 2023 | $5,548 | $199,331 | $43,160 | $156,171 |
| 2022 | $2,297 | $148,050 | $8,200 | $139,850 |
| 2021 | $2,792 | $134,590 | $39,070 | $95,520 |
| 2020 | $2,597 | $122,350 | $38,560 | $83,790 |
| 2019 | $2,540 | $111,230 | $23,080 | $88,150 |
| 2018 | $2,347 | $101,120 | $23,080 | $78,040 |
| 2017 | $2,146 | $91,930 | $23,080 | $68,850 |
| 2016 | $2,061 | $88,280 | $23,080 | $65,200 |
| 2015 | $1,580 | $86,770 | $23,080 | $63,690 |
| 2014 | $1,724 | $86,000 | $23,080 | $62,920 |
Source: Public Records
Map
Nearby Homes
Your Personal Tour Guide
Ask me questions while you tour the home.