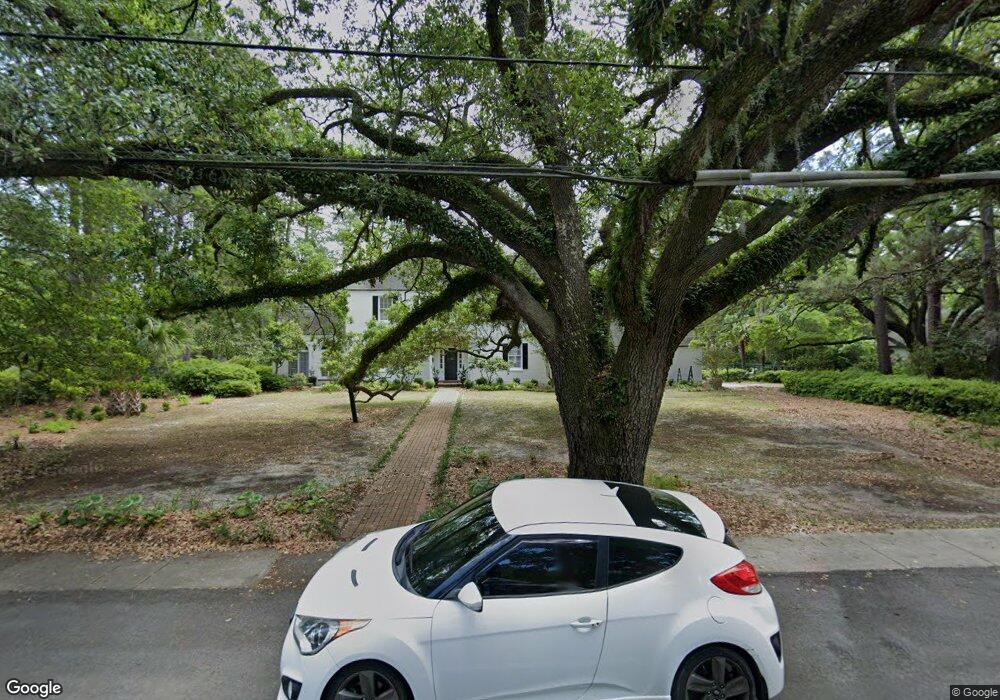
1401 9th Ave Conway, SC 29526
Estimated Value: $438,000 - $555,838
4
Beds
4
Baths
3,467
Sq Ft
$144/Sq Ft
Est. Value
About This Home
This home is located at 1401 9th Ave, Conway, SC 29526 and is currently estimated at $498,460, approximately $143 per square foot. 1401 9th Ave is a home located in Horry County with nearby schools including Conway Elementary School, Conway Middle School, and Conway High School.
Ownership History
Date
Name
Owned For
Owner Type
Purchase Details
Closed on
Mar 27, 2024
Sold by
Long John Reuben
Bought by
Long John Reuben Ii Tr and Long Mary Hill Tr
Current Estimated Value
Purchase Details
Closed on
Nov 13, 2020
Sold by
Sasser Suzanne Hopkins
Bought by
Long John Reuben and Long Mary Hill
Home Financials for this Owner
Home Financials are based on the most recent Mortgage that was taken out on this home.
Original Mortgage
$285,000
Interest Rate
2.8%
Mortgage Type
New Conventional
Purchase Details
Closed on
Jul 27, 2010
Sold by
Clark James Christopher
Bought by
Clark Suzanne S
Purchase Details
Closed on
Feb 1, 2001
Sold by
Clark Suzanne S
Bought by
Clark Christopher
Create a Home Valuation Report for This Property
The Home Valuation Report is an in-depth analysis detailing your home's value as well as a comparison with similar homes in the area
Home Values in the Area
Average Home Value in this Area
Purchase History
| Date | Buyer | Sale Price | Title Company |
|---|---|---|---|
| Long John Reuben Ii Tr | -- | -- | |
| Long John Reuben | $300,000 | -- | |
| Clark Suzanne S | -- | -- | |
| Clark Christopher | -- | -- | |
| Clark Suzanne S | -- | -- |
Source: Public Records
Mortgage History
| Date | Status | Borrower | Loan Amount |
|---|---|---|---|
| Previous Owner | Long John Reuben | $285,000 |
Source: Public Records
Tax History
| Year | Tax Paid | Tax Assessment Tax Assessment Total Assessment is a certain percentage of the fair market value that is determined by local assessors to be the total taxable value of land and additions on the property. | Land | Improvement |
|---|---|---|---|---|
| 2025 | $2,248 | $0 | $0 | $0 |
| 2024 | $2,248 | $15,993 | $6,191 | $9,802 |
| 2023 | $2,208 | $12,196 | $4,448 | $7,748 |
| 2021 | $1,780 | $12,196 | $4,448 | $7,748 |
| 2020 | $1,165 | $10,508 | $4,448 | $6,060 |
| 2019 | $1,165 | $10,508 | $4,448 | $6,060 |
| 2018 | $1,073 | $7,408 | $4,380 | $3,028 |
| 2017 | $1,073 | $7,408 | $4,380 | $3,028 |
| 2016 | -- | $7,408 | $4,380 | $3,028 |
| 2015 | $1,073 | $7,408 | $4,380 | $3,028 |
| 2014 | $1,020 | $7,408 | $4,380 | $3,028 |
Source: Public Records
Map
Nearby Homes
- 1305 Forest View Rd
- 2204 6th Ave
- 509 Beaty St
- 1011 Hickory Cir
- 1006 10th Ave
- 1105 Hickory Dr
- TBD 4.48 acres E Highway 501
- TBD HWY 501 E Highway 501
- 1011 Tin Top Aly
- 1009 Tin Top Aly
- 903 Durant St
- 1717 Racepath Ave
- TBD Highway 378
- 1520 4th Ave
- 1503 Ward Cir
- Lot 1 & 2 College Park Rd Unit COLLEGE PARK
- 1325 Parkside Ct
- Hunting Swamp Rd
- 7921 U S 701 Hwy
- 1517 3rd Ave
Your Personal Tour Guide
Ask me questions while you tour the home.