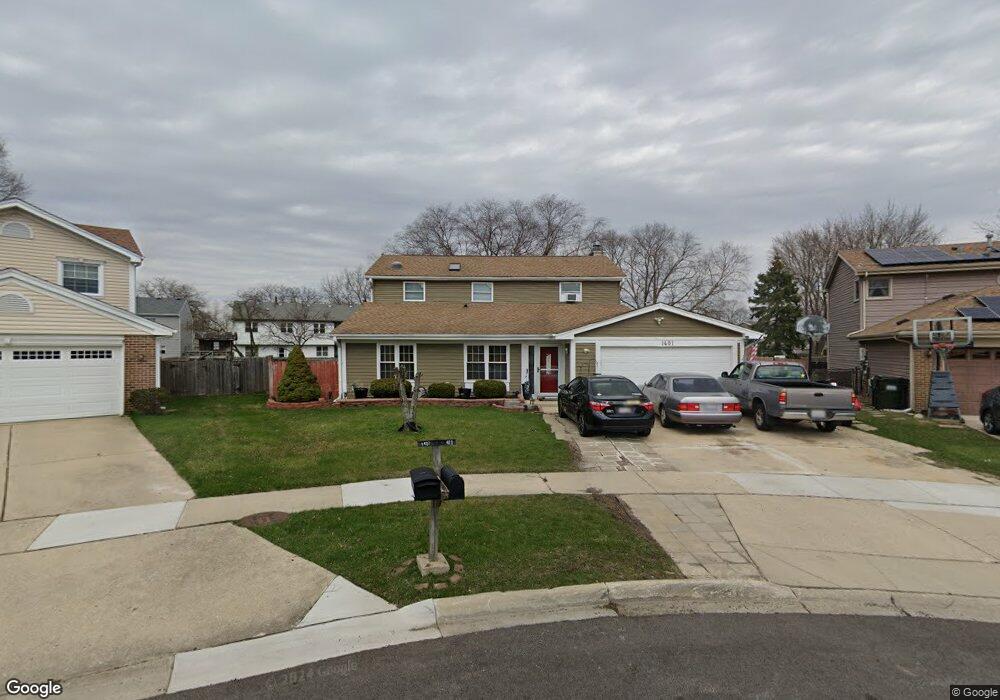
1401 Bow String Ct Carol Stream, IL 60188
Estimated Value: $394,000 - $464,000
3
Beds
2
Baths
2,544
Sq Ft
$170/Sq Ft
Est. Value
About This Home
This home is located at 1401 Bow String Ct, Carol Stream, IL 60188 and is currently estimated at $433,073, approximately $170 per square foot. 1401 Bow String Ct is a home located in DuPage County with nearby schools including Spring Trail Elementary School, Eastview Middle School, and Bartlett High School.
Ownership History
Date
Name
Owned For
Owner Type
Purchase Details
Closed on
Jul 14, 2004
Sold by
Hatfield Marc and Hatfield Amy
Bought by
Bahena Jose A and Bahena Aida I
Current Estimated Value
Home Financials for this Owner
Home Financials are based on the most recent Mortgage that was taken out on this home.
Original Mortgage
$220,410
Outstanding Balance
$109,102
Interest Rate
6.08%
Mortgage Type
Purchase Money Mortgage
Estimated Equity
$323,971
Purchase Details
Closed on
Aug 15, 2001
Sold by
Murabito Christopher J and Murabito Maria C
Bought by
Hatfield Marc and Hatfield Amy
Home Financials for this Owner
Home Financials are based on the most recent Mortgage that was taken out on this home.
Original Mortgage
$165,300
Interest Rate
7.06%
Mortgage Type
Balloon
Purchase Details
Closed on
Jun 7, 1996
Sold by
Johnstone Douglas S and Johstone Karen A
Bought by
Murabito Christopher J and Murabito Maria C
Home Financials for this Owner
Home Financials are based on the most recent Mortgage that was taken out on this home.
Original Mortgage
$131,084
Interest Rate
8.05%
Mortgage Type
FHA
Create a Home Valuation Report for This Property
The Home Valuation Report is an in-depth analysis detailing your home's value as well as a comparison with similar homes in the area
Home Values in the Area
Average Home Value in this Area
Purchase History
| Date | Buyer | Sale Price | Title Company |
|---|---|---|---|
| Bahena Jose A | $245,000 | Atg | |
| Hatfield Marc | $174,000 | -- | |
| Murabito Christopher J | $133,000 | -- |
Source: Public Records
Mortgage History
| Date | Status | Borrower | Loan Amount |
|---|---|---|---|
| Open | Bahena Jose A | $220,410 | |
| Previous Owner | Hatfield Marc | $165,300 | |
| Previous Owner | Murabito Christopher J | $131,084 |
Source: Public Records
Tax History
| Year | Tax Paid | Tax Assessment Tax Assessment Total Assessment is a certain percentage of the fair market value that is determined by local assessors to be the total taxable value of land and additions on the property. | Land | Improvement |
|---|---|---|---|---|
| 2024 | $9,613 | $133,389 | $33,926 | $99,463 |
| 2023 | $8,850 | $121,020 | $30,780 | $90,240 |
| 2022 | $8,654 | $110,490 | $28,610 | $81,880 |
| 2021 | $8,365 | $104,890 | $27,160 | $77,730 |
| 2020 | $8,127 | $101,750 | $26,350 | $75,400 |
| 2019 | $8,012 | $98,120 | $25,410 | $72,710 |
| 2018 | $7,291 | $89,960 | $24,320 | $65,640 |
| 2017 | $6,828 | $82,800 | $23,350 | $59,450 |
| 2016 | $6,709 | $79,090 | $22,300 | $56,790 |
| 2015 | $6,762 | $74,870 | $21,110 | $53,760 |
| 2014 | $5,058 | $72,970 | $20,570 | $52,400 |
| 2013 | $6,029 | $74,720 | $21,060 | $53,660 |
Source: Public Records
Map
Nearby Homes
- 1328 Big Horn Trail
- 403 Cromwell Cir Unit 2
- 1811 Rizzi Ln
- 1239 Spring Valley Dr
- 1297 Woodlake Dr Unit 1
- 422 Cromwell Cir Unit 2
- 1266 Seabury Cir
- 264 Norway Ct
- 2198 Wildwood Ln
- 1215 Robin Dr
- 1308 Coldspring Rd Unit 7
- 2325 Bayside Dr
- 272 Village Ln
- 1874 Windward Ln
- 1643 Colfax Ct Unit 4
- 1632 Columbia Cir Unit 2
- 1619 Camberley Ct Unit 2
- 1632 Columbia Cir Unit 4
- 1480 Harmony Dr
- 1901 Pastoral Ln
- 1399 Bow String Ct
- 1308 Antigo Trail
- 1402 Bow String Ct
- 1312 Antigo Trail
- 1300 Antigo Trail
- 1397 Bow String Ct
- 1298 Antigo Trail
- 1402 Appomattox Trail
- 1400 Bow String Ct
- 1400 Appomattox Trail
- 1326 Antigo Trail
- 1395 Bow String Ct
- 1398 Appomattox Trail
- 1398 Bow String Ct
- 1290 Antigo Trail
- 1332 Antigo Trail
- 1396 Bow String Ct
- 1396 Appomattox Trail
- 1393 Bow String Ct
- 1299 Antigo Trail
Your Personal Tour Guide
Ask me questions while you tour the home.