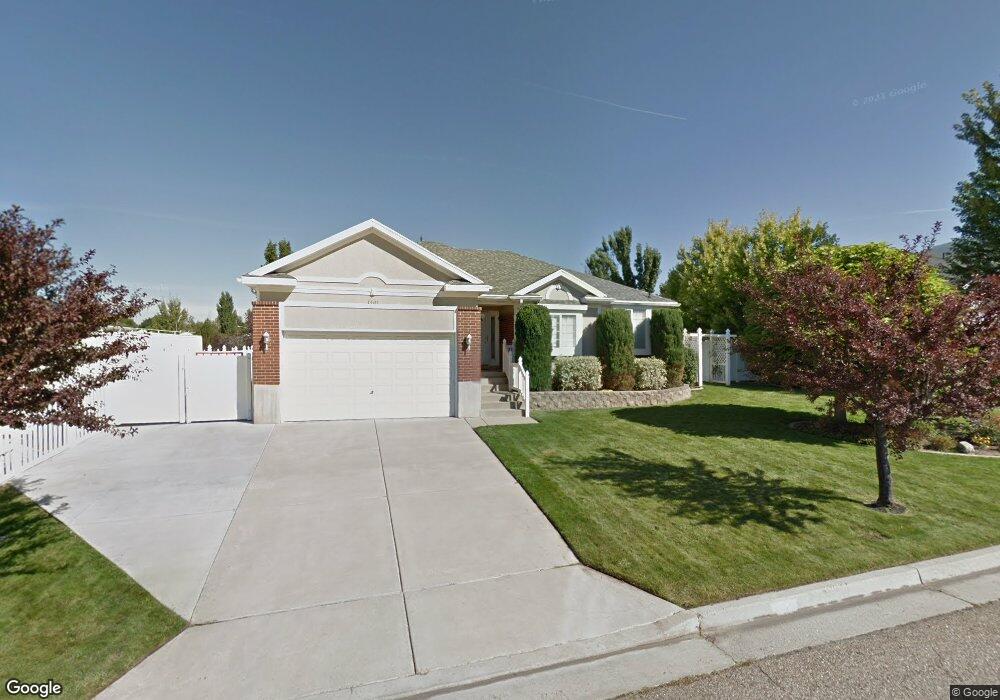
1401 E 850 N Layton, UT 84040
Estimated Value: $516,000 - $603,000
4
Beds
3
Baths
3,102
Sq Ft
$185/Sq Ft
Est. Value
About This Home
This home is located at 1401 E 850 N, Layton, UT 84040 and is currently estimated at $575,037, approximately $185 per square foot. 1401 E 850 N is a home located in Davis County with nearby schools including King Elementary School, Central Davis Junior High School, and Layton High School.
Ownership History
Date
Name
Owned For
Owner Type
Purchase Details
Closed on
Feb 1, 2008
Sold by
Campbell Craig
Bought by
Campbell Craig and Campbell Heidi
Current Estimated Value
Home Financials for this Owner
Home Financials are based on the most recent Mortgage that was taken out on this home.
Original Mortgage
$274,600
Outstanding Balance
$173,423
Interest Rate
6.17%
Mortgage Type
New Conventional
Estimated Equity
$401,614
Purchase Details
Closed on
Sep 21, 2006
Sold by
Christiansen David C and Christiansen Julie A
Bought by
Campbell Craig and Campbell Heidi
Home Financials for this Owner
Home Financials are based on the most recent Mortgage that was taken out on this home.
Original Mortgage
$53,980
Interest Rate
6.13%
Mortgage Type
Stand Alone Second
Purchase Details
Closed on
Aug 11, 2000
Sold by
Dickson Stuart H and Dickson Amy L
Bought by
Christiansen David C and Christiansen Julie A
Home Financials for this Owner
Home Financials are based on the most recent Mortgage that was taken out on this home.
Original Mortgage
$178,950
Interest Rate
7.5%
Create a Home Valuation Report for This Property
The Home Valuation Report is an in-depth analysis detailing your home's value as well as a comparison with similar homes in the area
Home Values in the Area
Average Home Value in this Area
Purchase History
| Date | Buyer | Sale Price | Title Company |
|---|---|---|---|
| Campbell Craig | -- | Accommodation | |
| Campbell Craig | -- | Backman Title Services | |
| Campbell Craig | -- | Backman Title Services | |
| Christiansen David C | -- | Associated Title Company |
Source: Public Records
Mortgage History
| Date | Status | Borrower | Loan Amount |
|---|---|---|---|
| Open | Campbell Craig | $274,600 | |
| Closed | Campbell Craig | $53,980 | |
| Closed | Campbell Craig | $215,920 | |
| Previous Owner | Christiansen David C | $178,950 |
Source: Public Records
Tax History
| Year | Tax Paid | Tax Assessment Tax Assessment Total Assessment is a certain percentage of the fair market value that is determined by local assessors to be the total taxable value of land and additions on the property. | Land | Improvement |
|---|---|---|---|---|
| 2025 | $2,819 | $295,900 | $119,582 | $176,318 |
| 2024 | $2,694 | $284,900 | $144,241 | $140,659 |
| 2023 | $2,758 | $514,000 | $196,366 | $317,634 |
| 2022 | $2,766 | $279,950 | $105,164 | $174,786 |
| 2021 | $2,663 | $402,000 | $159,784 | $242,216 |
| 2020 | $2,444 | $354,000 | $128,329 | $225,671 |
| 2019 | $2,390 | $339,000 | $114,863 | $224,137 |
| 2018 | $2,198 | $313,000 | $88,606 | $224,394 |
| 2016 | $1,954 | $143,550 | $49,146 | $94,404 |
| 2015 | $1,994 | $139,040 | $49,146 | $89,894 |
| 2014 | $1,738 | $123,927 | $49,146 | $74,781 |
| 2013 | -- | $124,286 | $25,362 | $98,924 |
Source: Public Records
Map
Nearby Homes
- 1545 E 975 N
- 1033 E 825 N
- 1156 Cherrywood Dr
- 1503 E 530 N
- 997 E 825 N
- 479 N 1375 E
- 1258 E North Lisa St
- 508 N Adamswood Rd
- 861 E 575 N
- 1048 E Cherry Ln
- 556 N Fairfield Rd Unit A2
- 556 N Fairfield Rd Unit D1
- 556 N Fairfield Rd Unit D2
- 556 N Fairfield Rd Unit A3
- 556 N Fairfield Rd Unit D3
- 556 N Fairfield Rd Unit D4
- 556 N Fairfield Rd Unit A1
- 556 N Fairfield Rd Unit A4
- 1148 N 1875 E Unit 2
- 1515 E Gentile St
- 1383 E 850 N
- 1415 E 850 N
- 905 Country Hills Dr
- 905 N 1345 E
- 895 Country Hills Dr
- 1367 E 850 N
- 871 N 1345 E
- 1384 E 850 N
- 1406 E 850 N
- 1406 E 850 N Unit 120
- 1423 E 850 N
- 923 Country Hills Dr
- 1352 E Gordon Ave
- 923 N 1345 E
- 1416 E 850 N
- 831 N 1345 E
- 831 Country Hills Dr
- 1424 E 850 N
- 819 N 1345 E
- 819 Country Hills Dr
Your Personal Tour Guide
Ask me questions while you tour the home.