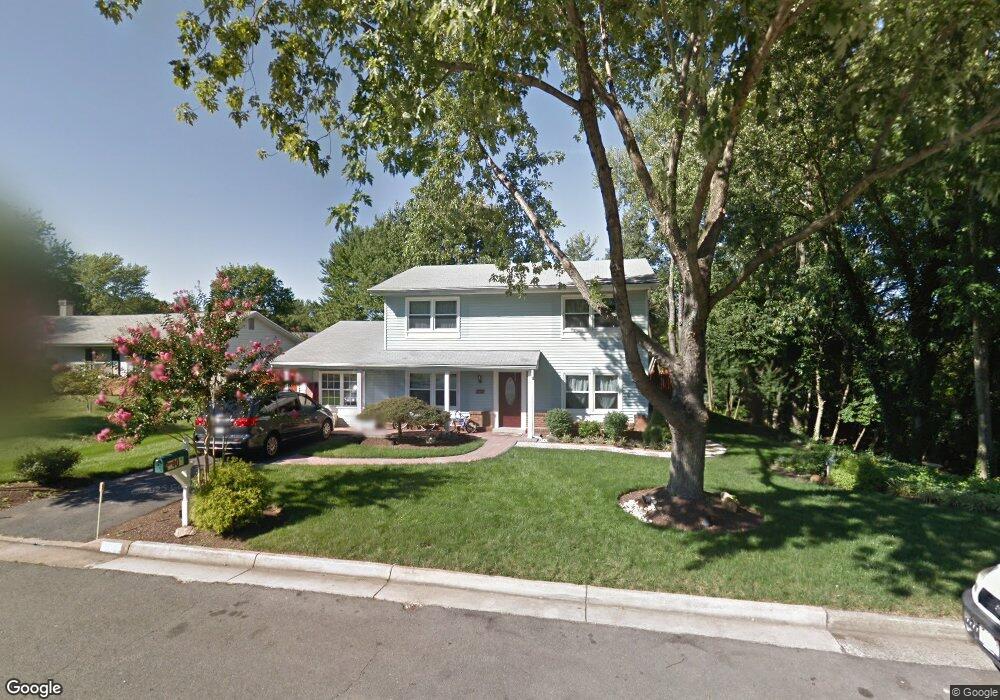
1401 E Iberia Rd Sterling, VA 20164
Estimated Value: $648,708 - $666,000
4
Beds
3
Baths
2,128
Sq Ft
$308/Sq Ft
Est. Value
About This Home
This home is located at 1401 E Iberia Rd, Sterling, VA 20164 and is currently estimated at $656,427, approximately $308 per square foot. 1401 E Iberia Rd is a home located in Loudoun County with nearby schools including Sully Elementary School, Sterling Middle School, and Park View High School.
Ownership History
Date
Name
Owned For
Owner Type
Purchase Details
Closed on
Jun 30, 2008
Sold by
Citimortgage Inc
Bought by
Proano Luis
Current Estimated Value
Home Financials for this Owner
Home Financials are based on the most recent Mortgage that was taken out on this home.
Original Mortgage
$257,962
Outstanding Balance
$165,912
Interest Rate
6.01%
Mortgage Type
FHA
Estimated Equity
$490,515
Purchase Details
Closed on
May 20, 2005
Sold by
Adams Suzanne Nguyen
Bought by
Alba Andrade Luis A and Barahona,Bernadrina Alba
Home Financials for this Owner
Home Financials are based on the most recent Mortgage that was taken out on this home.
Original Mortgage
$386,400
Interest Rate
5.95%
Mortgage Type
New Conventional
Purchase Details
Closed on
Apr 20, 1999
Sold by
Colson Angela M
Bought by
Nguyen Kim H
Home Financials for this Owner
Home Financials are based on the most recent Mortgage that was taken out on this home.
Original Mortgage
$118,500
Interest Rate
7.02%
Create a Home Valuation Report for This Property
The Home Valuation Report is an in-depth analysis detailing your home's value as well as a comparison with similar homes in the area
Home Values in the Area
Average Home Value in this Area
Purchase History
| Date | Buyer | Sale Price | Title Company |
|---|---|---|---|
| Proano Luis | $260,000 | -- | |
| Alba Andrade Luis A | $483,000 | -- | |
| Nguyen Kim H | $125,000 | -- |
Source: Public Records
Mortgage History
| Date | Status | Borrower | Loan Amount |
|---|---|---|---|
| Open | Proano Luis | $257,962 | |
| Previous Owner | Alba Andrade Luis A | $386,400 | |
| Previous Owner | Nguyen Kim H | $118,500 |
Source: Public Records
Tax History
| Year | Tax Paid | Tax Assessment Tax Assessment Total Assessment is a certain percentage of the fair market value that is determined by local assessors to be the total taxable value of land and additions on the property. | Land | Improvement |
|---|---|---|---|---|
| 2025 | $4,914 | $610,410 | $234,100 | $376,310 |
| 2024 | $4,780 | $552,630 | $209,100 | $343,530 |
| 2023 | $4,832 | $552,180 | $209,100 | $343,080 |
| 2022 | $4,347 | $488,440 | $189,100 | $299,340 |
| 2021 | $4,236 | $432,290 | $179,100 | $253,190 |
| 2020 | $4,230 | $408,740 | $154,100 | $254,640 |
| 2019 | $4,119 | $394,180 | $154,100 | $240,080 |
| 2018 | $3,917 | $361,030 | $139,100 | $221,930 |
| 2017 | $3,932 | $349,500 | $139,100 | $210,400 |
| 2016 | $4,013 | $350,440 | $0 | $0 |
| 2015 | $3,618 | $198,160 | $0 | $198,160 |
| 2014 | $3,717 | $201,250 | $0 | $201,250 |
Source: Public Records
Map
Nearby Homes
- 1314 E Holly Ave
- 101 S Harrison Rd
- 204 Elizabeth Ct
- 132 N Fillmore Ave
- 1540 Powells Tavern Place
- 207 N Laura Anne Dr
- 503 S Maple Ct
- 102 N Duke Dr
- 308 E Cornell Dr
- 1543 Youngs Point Place
- 12815 Briery River Terrace
- 12819 Fantasia Dr
- 301 N Alder Ave
- 229 Applegate Dr
- 12807 Lady Fairfax Cir
- 12807 Scranton Ct
- 113 Caragana Ct
- 12524 Philmont Dr
- 1359 Rock Chapel Rd
- 1407 Skyhaven Ct
- 1319 E Iberia Rd
- 1402 E Holly Ave
- 1317 E Iberia Rd
- 1400 E Holly Ave
- 1403 E Iberia Rd
- 200 S Johnson Rd
- 103 S Kennedy Rd
- 1320 E Holly Ave
- 1316 E Iberia Rd
- 101 S Kennedy Rd
- 1318 E Holly Ave
- 201 S Kennedy Rd
- 1315 E Iberia Rd
- 202 S Johnson Rd
- 1314 E Iberia Rd
- 1316 E Holly Ave
- 203 S Johnson Rd
- 203 S Kennedy Rd
- 1313 E Iberia Rd
- 100 N Johnson Rd
Your Personal Tour Guide
Ask me questions while you tour the home.