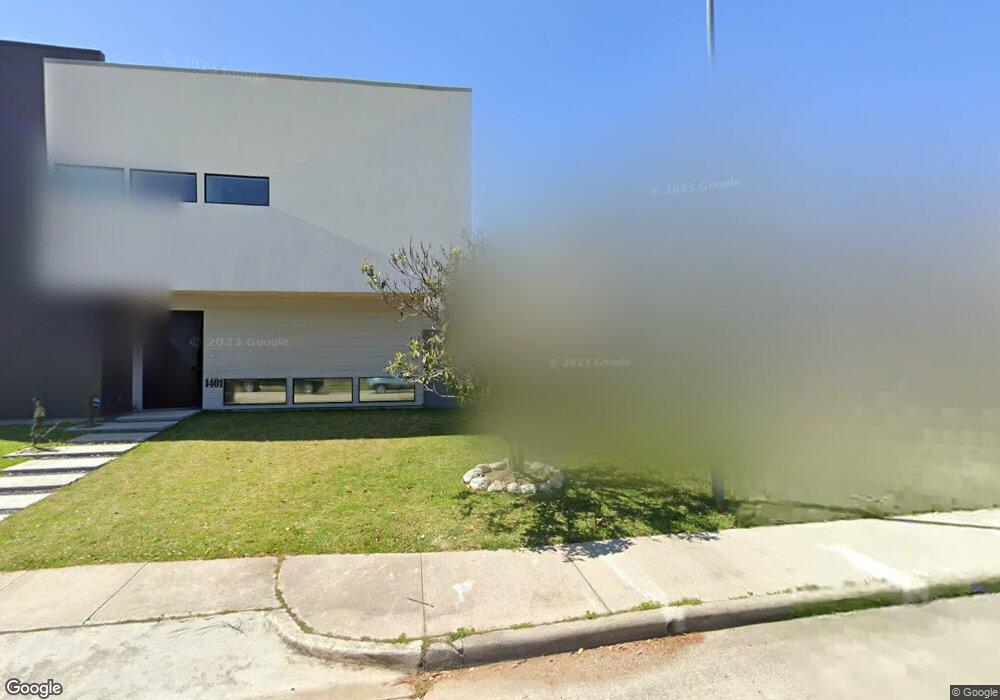
1401 Glenmore Forest St Houston, TX 77055
Spring Branch East NeighborhoodEstimated Value: $512,000 - $1,501,000
3
Beds
4
Baths
3,834
Sq Ft
$316/Sq Ft
Est. Value
About This Home
This home is located at 1401 Glenmore Forest St, Houston, TX 77055 and is currently estimated at $1,210,629, approximately $315 per square foot. 1401 Glenmore Forest St is a home located in Harris County with nearby schools including Valley Oaks Elementary School, Landrum Middle School, and Memorial High School.
Ownership History
Date
Name
Owned For
Owner Type
Purchase Details
Closed on
Sep 27, 2017
Sold by
Gillian David W
Bought by
Le Perezanta Jose Iganacto and Le Salomon Said
Current Estimated Value
Home Financials for this Owner
Home Financials are based on the most recent Mortgage that was taken out on this home.
Original Mortgage
$261,600
Outstanding Balance
$215,820
Interest Rate
3.37%
Mortgage Type
Adjustable Rate Mortgage/ARM
Estimated Equity
$994,809
Purchase Details
Closed on
Jul 16, 1998
Sold by
Blax Inc
Bought by
Gillilan David W
Home Financials for this Owner
Home Financials are based on the most recent Mortgage that was taken out on this home.
Original Mortgage
$60,800
Interest Rate
7.09%
Purchase Details
Closed on
Sep 25, 1996
Sold by
Stearns Stanley D
Bought by
Blax Inc
Create a Home Valuation Report for This Property
The Home Valuation Report is an in-depth analysis detailing your home's value as well as a comparison with similar homes in the area
Home Values in the Area
Average Home Value in this Area
Purchase History
| Date | Buyer | Sale Price | Title Company |
|---|---|---|---|
| Le Perezanta Jose Iganacto | -- | None Available | |
| Gillilan David W | -- | -- | |
| Blax Inc | -- | -- | |
| Blax Inc | -- | -- |
Source: Public Records
Mortgage History
| Date | Status | Borrower | Loan Amount |
|---|---|---|---|
| Open | Le Perezanta Jose Iganacto | $261,600 | |
| Previous Owner | Gillilan David W | $60,800 |
Source: Public Records
Tax History Compared to Growth
Tax History
| Year | Tax Paid | Tax Assessment Tax Assessment Total Assessment is a certain percentage of the fair market value that is determined by local assessors to be the total taxable value of land and additions on the property. | Land | Improvement |
|---|---|---|---|---|
| 2025 | $18,922 | $1,214,536 | $473,200 | $741,336 |
| 2024 | $18,922 | $1,367,781 | $473,200 | $894,581 |
| 2023 | $18,922 | $1,030,993 | $439,400 | $591,593 |
| 2022 | $23,063 | $1,260,000 | $405,600 | $854,400 |
| 2021 | $23,516 | $963,202 | $371,800 | $591,402 |
| 2020 | $25,223 | $989,314 | $395,038 | $594,276 |
| 2019 | $10,181 | $402,808 | $395,038 | $7,770 |
| 2018 | $3,333 | $340,521 | $287,300 | $53,221 |
| 2017 | $5,908 | $340,521 | $304,200 | $36,321 |
| 2016 | $5,370 | $325,098 | $288,990 | $36,108 |
| 2015 | $3,403 | $325,098 | $288,990 | $36,108 |
| 2014 | $3,403 | $261,434 | $228,150 | $33,284 |
Source: Public Records
Map
Nearby Homes
- 1421 Glenmore Forest St
- 1310 Pine Chase Dr
- 1529 Wirt Rd Unit 27
- 1529 Wirt Rd Unit 6
- 1529 Wirt Rd Unit 19
- 1529 Wirt Rd Unit 20
- 8206 Westview Dr
- 1523 Cunningham Parc Ln
- 1519 Baggett Ln
- 8707 Padua Ln
- 7908 Westwood Dr
- 7938 S Wellington Ct
- 7903 S Wellington Ct
- 7818 Janak Dr Unit B
- 0 Wirt Rd
- 1518 Hillendahl Blvd
- 7718 S Hunters Court Dr Unit 1
- 1315 Shady Villa Pine
- 7702 Westside Villas Ln
- 1614 Johanna Dr Unit C
- 1405 Glenmore Forest St
- 1406 Glourie Dr
- 7934 Westview Dr
- 1409 Glenmore Forest St
- 1410 Glourie Dr
- 1413 Glenmore Forest St
- 1327 Glourie Dr
- 1414 Glourie Dr
- 1334 Glourie Dr
- 1401 Glourie Dr
- 1417 Glenmore Forest St
- 1324 Pine Chase Dr
- 1405 Glourie Dr
- 1418 Glourie Dr
- 1330 Glourie Dr
- 1409 Glourie Dr
- 8002 Westview Dr
- 1413 Glourie Dr
- 1322 Pine Chase Dr
- 1422 Glourie Dr