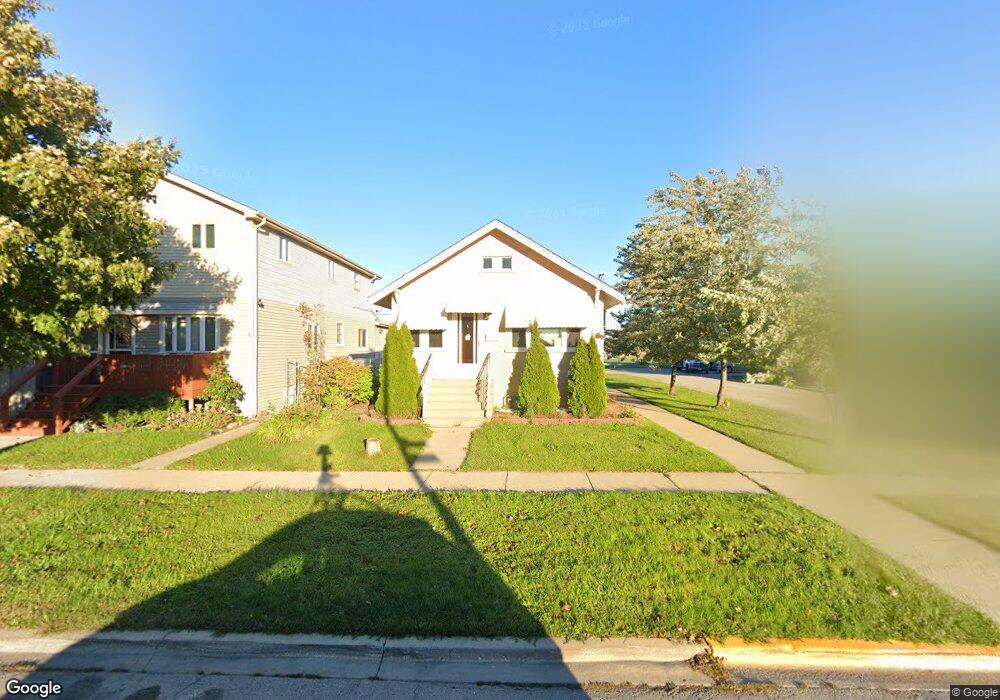
1401 N 11th Ave Melrose Park, IL 60160
Estimated Value: $292,321 - $340,000
2
Beds
1
Bath
864
Sq Ft
$362/Sq Ft
Est. Value
About This Home
This home is located at 1401 N 11th Ave, Melrose Park, IL 60160 and is currently estimated at $313,107, approximately $362 per square foot. 1401 N 11th Ave is a home located in Cook County with nearby schools including Jane Addams Elementary School, Stevenson Middle School, and Proviso East High School.
Ownership History
Date
Name
Owned For
Owner Type
Purchase Details
Closed on
May 12, 2009
Sold by
Fannie Mae
Bought by
Beltran Veronica
Current Estimated Value
Home Financials for this Owner
Home Financials are based on the most recent Mortgage that was taken out on this home.
Original Mortgage
$97,108
Outstanding Balance
$61,355
Interest Rate
4.85%
Mortgage Type
FHA
Estimated Equity
$251,752
Purchase Details
Closed on
Aug 4, 2008
Sold by
Pynakker Larry H
Bought by
Federal National Mortgage Association
Purchase Details
Closed on
Sep 24, 2001
Sold by
Henselman Ronald C and Henselman Linda A
Bought by
Pynakker Larry H and Pynakker Cassandra R
Home Financials for this Owner
Home Financials are based on the most recent Mortgage that was taken out on this home.
Original Mortgage
$133,900
Interest Rate
6.99%
Create a Home Valuation Report for This Property
The Home Valuation Report is an in-depth analysis detailing your home's value as well as a comparison with similar homes in the area
Home Values in the Area
Average Home Value in this Area
Purchase History
| Date | Buyer | Sale Price | Title Company |
|---|---|---|---|
| Beltran Veronica | -- | Git | |
| Federal National Mortgage Association | -- | None Available | |
| Pynakker Larry H | $144,000 | Chicago Title Insurance Co |
Source: Public Records
Mortgage History
| Date | Status | Borrower | Loan Amount |
|---|---|---|---|
| Open | Beltran Veronica | $97,108 | |
| Previous Owner | Pynakker Larry H | $133,900 |
Source: Public Records
Tax History Compared to Growth
Tax History
| Year | Tax Paid | Tax Assessment Tax Assessment Total Assessment is a certain percentage of the fair market value that is determined by local assessors to be the total taxable value of land and additions on the property. | Land | Improvement |
|---|---|---|---|---|
| 2024 | $4,855 | $22,000 | $4,378 | $17,622 |
| 2023 | $3,126 | $22,000 | $4,378 | $17,622 |
| 2022 | $3,126 | $13,566 | $3,770 | $9,796 |
| 2021 | $3,202 | $13,565 | $3,769 | $9,796 |
| 2020 | $3,182 | $13,565 | $3,769 | $9,796 |
| 2019 | $3,272 | $13,523 | $3,404 | $10,119 |
| 2018 | $3,258 | $13,523 | $3,404 | $10,119 |
| 2017 | $3,204 | $13,523 | $3,404 | $10,119 |
| 2016 | $2,939 | $11,666 | $3,040 | $8,626 |
| 2015 | $2,853 | $11,666 | $3,040 | $8,626 |
| 2014 | $2,781 | $11,666 | $3,040 | $8,626 |
| 2013 | $3,048 | $13,488 | $3,040 | $10,448 |
Source: Public Records
Map
Nearby Homes
- 1403 N 11th Ave
- 1407 N 11th Ave
- 1319 N 11th Ave
- 1409 N 11th Ave
- 1315 N 11th Ave
- 1417 N 11th Ave
- 1400 N 11th Ave
- 1400 N 11th Ave
- 1406 N 11th Ave
- 1419 N 11th Ave
- 1419 N 11th Ave
- 1311 N 11th Ave
- 1410 N 11th Ave
- 1305 N 11th Ave
- 1316 N 11th Ave
- 1310 N 11th Ave
- 1100 Division St
- 1306 N 11th Ave
- 1403 N 12th Ave
- 1407 N 12th Ave