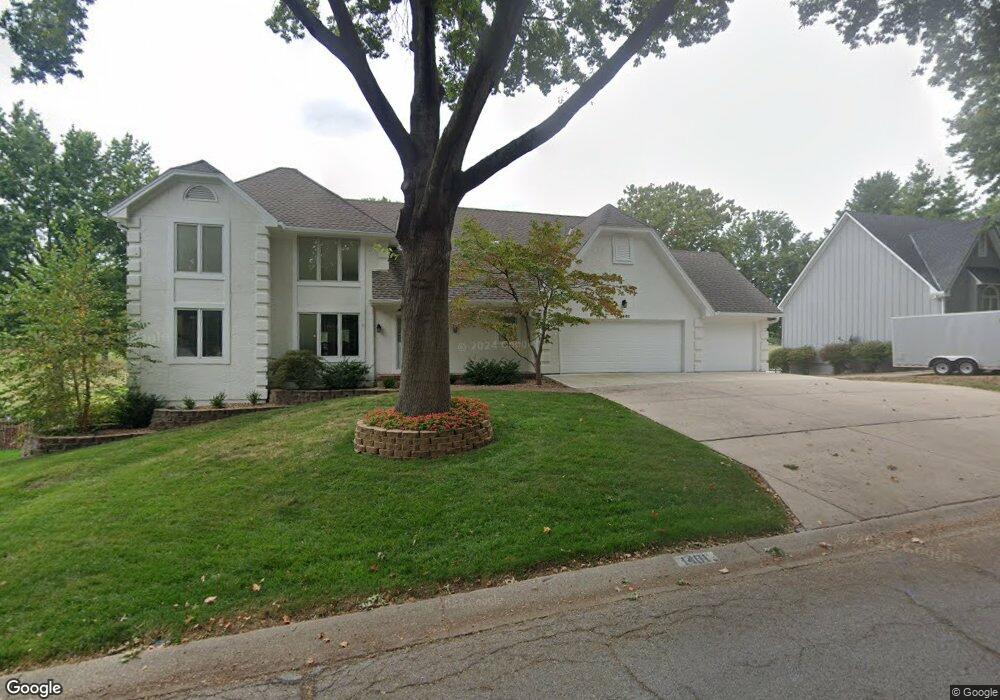
1401 NE Sunny Creek Ln Blue Springs, MO 64014
Estimated Value: $505,000 - $634,000
4
Beds
5
Baths
3,888
Sq Ft
$148/Sq Ft
Est. Value
About This Home
This home is located at 1401 NE Sunny Creek Ln, Blue Springs, MO 64014 and is currently estimated at $576,088, approximately $148 per square foot. 1401 NE Sunny Creek Ln is a home located in Jackson County with nearby schools including James Lewis Elementary School, Brittany Hill Middle School, and Blue Springs High School.
Ownership History
Date
Name
Owned For
Owner Type
Purchase Details
Closed on
Jul 21, 2004
Sold by
Boyd John B and Boyd Linda S
Bought by
Craig Robert G and Craig Sue A
Current Estimated Value
Home Financials for this Owner
Home Financials are based on the most recent Mortgage that was taken out on this home.
Original Mortgage
$320,000
Outstanding Balance
$160,912
Interest Rate
6.32%
Mortgage Type
Purchase Money Mortgage
Estimated Equity
$415,176
Purchase Details
Closed on
Jun 14, 1996
Sold by
Hutchings Richard R and Hutchings Mary Ann
Bought by
Boyd John B and Boyd Linda S
Home Financials for this Owner
Home Financials are based on the most recent Mortgage that was taken out on this home.
Original Mortgage
$220,000
Interest Rate
6%
Mortgage Type
Purchase Money Mortgage
Purchase Details
Closed on
Mar 18, 1996
Sold by
King Elsie Ann and King Elsie
Bought by
Hutchings Richard R and Hutchings Mary Ann
Create a Home Valuation Report for This Property
The Home Valuation Report is an in-depth analysis detailing your home's value as well as a comparison with similar homes in the area
Home Values in the Area
Average Home Value in this Area
Purchase History
| Date | Buyer | Sale Price | Title Company |
|---|---|---|---|
| Craig Robert G | -- | Security Land Title Company | |
| Boyd John B | -- | Stewart Title | |
| Hutchings Richard R | -- | First American Title Ins Co |
Source: Public Records
Mortgage History
| Date | Status | Borrower | Loan Amount |
|---|---|---|---|
| Open | Craig Robert G | $320,000 | |
| Previous Owner | Boyd John B | $220,000 |
Source: Public Records
Tax History Compared to Growth
Tax History
| Year | Tax Paid | Tax Assessment Tax Assessment Total Assessment is a certain percentage of the fair market value that is determined by local assessors to be the total taxable value of land and additions on the property. | Land | Improvement |
|---|---|---|---|---|
| 2025 | $7,595 | $107,065 | $11,273 | $95,792 |
| 2024 | $7,450 | $93,100 | $11,060 | $82,040 |
| 2023 | $7,450 | $93,100 | $11,060 | $82,040 |
| 2022 | $7,500 | $82,840 | $10,574 | $72,266 |
| 2021 | $7,493 | $82,840 | $10,574 | $72,266 |
| 2020 | $6,421 | $72,201 | $10,574 | $61,627 |
| 2019 | $7,587 | $88,249 | $10,574 | $77,675 |
| 2018 | $6,025 | $67,450 | $9,690 | $57,760 |
| 2017 | $6,025 | $67,450 | $9,690 | $57,760 |
| 2016 | $5,755 | $64,600 | $7,543 | $57,057 |
| 2014 | $5,774 | $64,600 | $7,737 | $56,863 |
Source: Public Records
Map
Nearby Homes
- 1200 NE Crestview Dr
- 705 NE Locust Dr
- 420 NE Golfview Dr
- 1200 NE Hilltop Dr
- 458 NE Coronado Dr
- 204 NW Golfview Dr
- 1136 NE 10th St
- 311 NE Bridge Place
- 1001 NE Wien Ave
- 517 NE Johnston Dr
- 404 NE Lee Dr
- 409 NW Locust Dr
- 1800 NE Waterfield Village Ct
- 0 NW Jefferson St
- 816 NE Mary Ct
- 1912 NW Manor Dr
- 280 NW Beau Dr
- 2401 NE Coronado Dr
- 678 NW Valleybrook Rd
- 0 NE Jefferson St
- 1313 NE Sunny Creek Ln
- 1405 NE Sunny Creek Ln
- 1404 NE Sunny Creek Ln
- 1406 NE Sunny Creek Ln
- 1309 NE Sunny Creek Ln
- 416 NE Sunview Cir
- 421 NE Country Club Dr
- 1500 NE Sunny Creek Ln
- 420 NE Sunview Cir
- 1501 NE Sunny Creek Ln
- 1305 NE Sunny Creek Ln
- 425 NE Country Club Dr
- 1308 NE Sunny Creek Ln
- 1308 NE Sunny Creek Ln
- 417 NE Sunview Cir
- 1300 NE Sunny Creek Ln
- 1504 NE Sunny Creek Ln
- 1505 NE Sunny Creek Ln
- 424 NE Sunview Cir
- 508 NE Country Club Dr