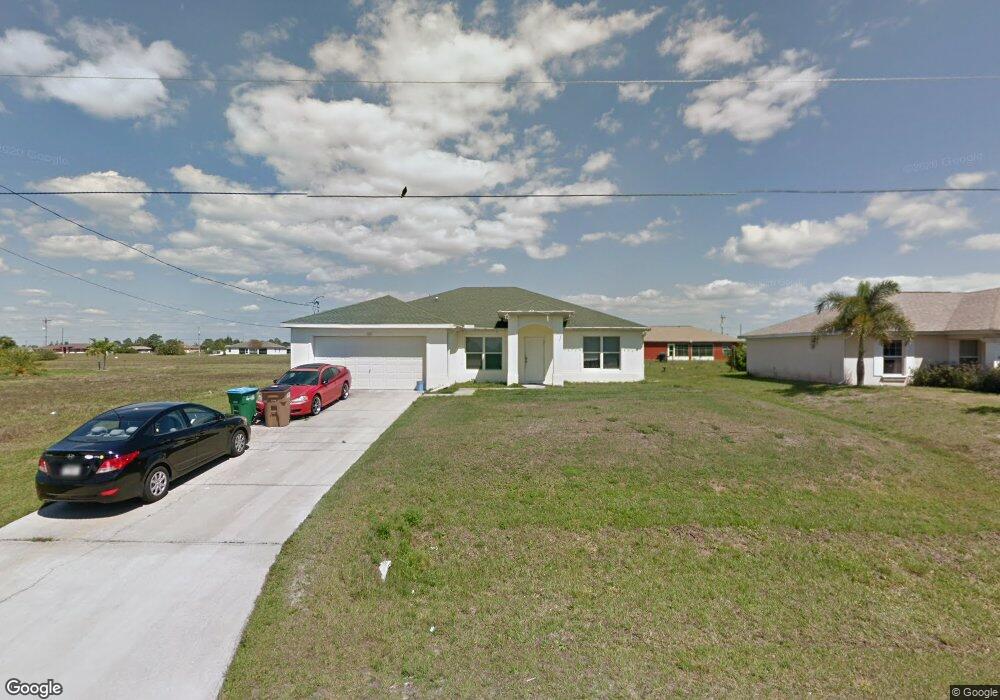
1401 NW 8th Place Cape Coral, FL 33993
Mariner NeighborhoodEstimated Value: $277,000 - $390,000
4
Beds
2
Baths
1,809
Sq Ft
$181/Sq Ft
Est. Value
About This Home
This home is located at 1401 NW 8th Place, Cape Coral, FL 33993 and is currently estimated at $328,067, approximately $181 per square foot. 1401 NW 8th Place is a home located in Lee County with nearby schools including Dr. Carrie D. Robinson Littleton Elementary School, Caloosa Elementary School, and Tropic Isles Elementary School.
Ownership History
Date
Name
Owned For
Owner Type
Purchase Details
Closed on
Feb 25, 2011
Sold by
Fannie Mae
Bought by
Iny Enterprises Llc
Current Estimated Value
Purchase Details
Closed on
Nov 12, 2010
Sold by
Marquis Oscar
Bought by
Federal National Mortgage Association
Purchase Details
Closed on
Jan 16, 2004
Sold by
Resto Jose R and Alvarado Noralissa Baerga
Bought by
Moore Jessica E
Purchase Details
Closed on
Nov 9, 1999
Sold by
Royal W Prop Inc
Bought by
Resto Jose R and Alvarado Noralisa Baerga
Home Financials for this Owner
Home Financials are based on the most recent Mortgage that was taken out on this home.
Original Mortgage
$7,650
Interest Rate
7.7%
Purchase Details
Closed on
Nov 11, 1998
Sold by
Portanova Nicholas M
Bought by
Royal W Prop Inc
Home Financials for this Owner
Home Financials are based on the most recent Mortgage that was taken out on this home.
Original Mortgage
$115,643
Interest Rate
6.77%
Create a Home Valuation Report for This Property
The Home Valuation Report is an in-depth analysis detailing your home's value as well as a comparison with similar homes in the area
Home Values in the Area
Average Home Value in this Area
Purchase History
| Date | Buyer | Sale Price | Title Company |
|---|---|---|---|
| Iny Enterprises Llc | $79,900 | Attorney | |
| Federal National Mortgage Association | $75,000 | Attorney | |
| Moore Jessica E | $14,500 | -- | |
| Resto Jose R | $8,500 | -- | |
| Royal W Prop Inc | $1,500 | -- |
Source: Public Records
Mortgage History
| Date | Status | Borrower | Loan Amount |
|---|---|---|---|
| Previous Owner | Resto Jose R | $7,650 | |
| Previous Owner | Royal W Prop Inc | $115,643 |
Source: Public Records
Tax History Compared to Growth
Tax History
| Year | Tax Paid | Tax Assessment Tax Assessment Total Assessment is a certain percentage of the fair market value that is determined by local assessors to be the total taxable value of land and additions on the property. | Land | Improvement |
|---|---|---|---|---|
| 2025 | $4,537 | $234,826 | $33,915 | $200,911 |
| 2024 | $4,369 | $221,807 | -- | -- |
| 2023 | $4,369 | $201,643 | $0 | $0 |
| 2022 | $3,904 | $183,312 | $0 | $0 |
| 2021 | $3,470 | $166,647 | $7,800 | $158,847 |
| 2020 | $3,376 | $155,851 | $10,100 | $145,751 |
| 2019 | $3,264 | $151,007 | $10,500 | $140,507 |
| 2018 | $3,283 | $152,621 | $10,500 | $142,121 |
| 2017 | $3,129 | $146,164 | $6,800 | $139,364 |
| 2016 | $2,860 | $129,293 | $6,800 | $122,493 |
| 2015 | $2,641 | $112,895 | $6,100 | $106,795 |
| 2014 | -- | $104,802 | $5,640 | $99,162 |
| 2013 | -- | $96,692 | $4,100 | $92,592 |
Source: Public Records
Map
Nearby Homes
- 1413 NW 8th Place
- 1112 NW 8th Place
- 929 NW 8th Place
- 1424 Nelson Rd N
- 1400 Nelson Rd N
- 307 Nelson Rd N
- 1616 Nelson Rd N
- 3017 Nelson Rd N
- 1409 NW 7th Place
- 1322 NW 7th Place
- 2425 NW 7th Place
- 2710 NW 7th Place
- 1312 NW 9th Ave
- 1321 NW 9th Place
- 1300 NW 8th Place
- 922 NW 13th Terrace
- 1227 NW 8th Place
- 1601 NW 9th Ave
- 1329 NW 10th Ave
- 1329 NW 10th Place
- 1331 NW 8th Place
- 1405 NW 8th Place
- 1409 NW 8th Place
- 1327 NW 8th Place
- 1330 Nelson Rd N
- 1404 Nelson Rd N
- 1332 NW 8th Place
- 1402 NW 8th Place
- 1406 NW 8th Place
- 1328 NW 8th Place
- 1323 NW 8th Place
- 1322 Nelson Rd N
- 1412 Nelson Rd N
- 1403 NW 9th Ave
- 1333 NW 9th Ave
- 1417 NW 8th Place
- 1407 NW 9th Ave
- 1414 NW 8th Place
- 1318 Nelson Rd N
- 1411 NW 9th Ave