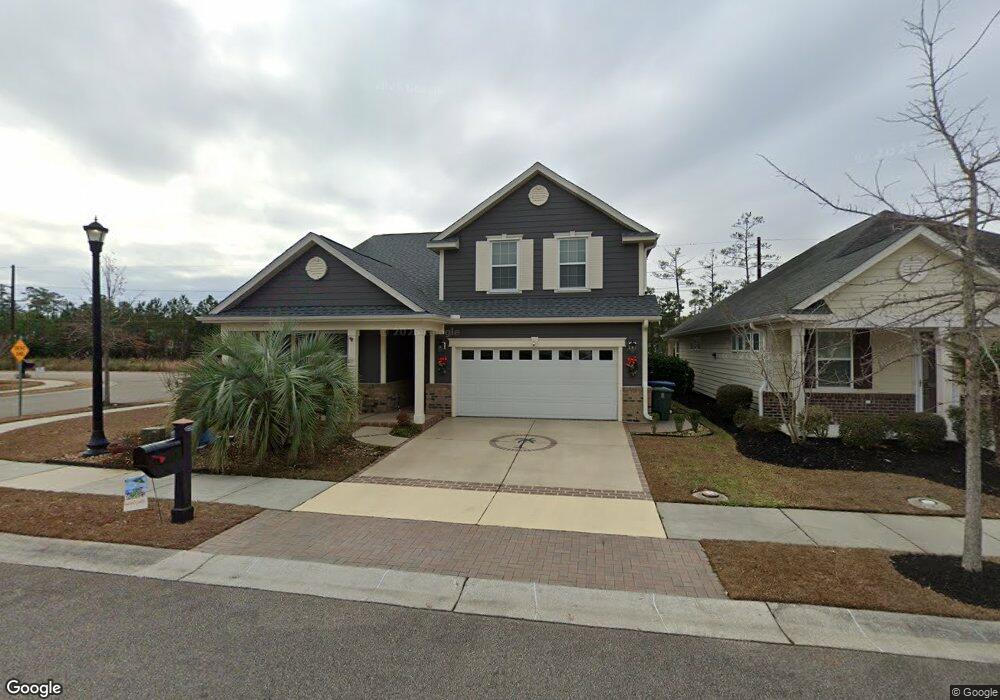
1401 Thames Ct Unit 1401 Myrtle Beach, SC 29577
Market Commons NeighborhoodEstimated Value: $366,000 - $431,072
3
Beds
2
Baths
1,248
Sq Ft
$329/Sq Ft
Est. Value
About This Home
This home is located at 1401 Thames Ct Unit 1401, Myrtle Beach, SC 29577 and is currently estimated at $410,518, approximately $328 per square foot. 1401 Thames Ct Unit 1401 is a home located in Horry County with nearby schools including Myrtle Beach Child Development Center, Myrtle Beach Primary School, and Myrtle Beach Elementary School.
Ownership History
Date
Name
Owned For
Owner Type
Purchase Details
Closed on
Sep 26, 2016
Sold by
Mclean Marolyn T
Bought by
Malone Brantley
Current Estimated Value
Home Financials for this Owner
Home Financials are based on the most recent Mortgage that was taken out on this home.
Original Mortgage
$142,500
Outstanding Balance
$116,569
Interest Rate
4.12%
Mortgage Type
New Conventional
Estimated Equity
$293,949
Purchase Details
Closed on
Apr 2, 2015
Sold by
Overton Michael M and Overton Cathy J
Bought by
Mclean Marolyn T
Home Financials for this Owner
Home Financials are based on the most recent Mortgage that was taken out on this home.
Original Mortgage
$132,000
Interest Rate
4.5%
Mortgage Type
Adjustable Rate Mortgage/ARM
Purchase Details
Closed on
Apr 13, 2011
Sold by
Armadi Mehan M
Bought by
Overton Michael M
Purchase Details
Closed on
Aug 22, 2003
Sold by
Virginia Palms Llc
Bought by
Armadi Mehan M and Armadi Jila A
Create a Home Valuation Report for This Property
The Home Valuation Report is an in-depth analysis detailing your home's value as well as a comparison with similar homes in the area
Home Values in the Area
Average Home Value in this Area
Purchase History
| Date | Buyer | Sale Price | Title Company |
|---|---|---|---|
| Malone Brantley | $190,000 | -- | |
| Mclean Marolyn T | $176,000 | -- | |
| Overton Michael M | $186,000 | -- | |
| Armadi Mehan M | $160,000 | -- |
Source: Public Records
Mortgage History
| Date | Status | Borrower | Loan Amount |
|---|---|---|---|
| Open | Malone Brantley | $142,500 | |
| Closed | Malone Brantley | $142,500 | |
| Previous Owner | Mclean Marolyn T | $132,000 |
Source: Public Records
Tax History Compared to Growth
Tax History
| Year | Tax Paid | Tax Assessment Tax Assessment Total Assessment is a certain percentage of the fair market value that is determined by local assessors to be the total taxable value of land and additions on the property. | Land | Improvement |
|---|---|---|---|---|
| 2024 | $3,656 | $31,134 | $0 | $31,134 |
| 2023 | $3,656 | $23,100 | $0 | $23,100 |
| 2021 | $3,375 | $23,100 | $0 | $23,100 |
| 2020 | $3,219 | $23,100 | $0 | $23,100 |
| 2019 | $3,219 | $23,100 | $0 | $23,100 |
| 2018 | $0 | $19,005 | $0 | $19,005 |
| 2017 | $2,856 | $10,860 | $0 | $10,860 |
| 2016 | -- | $10,740 | $0 | $10,740 |
| 2015 | $448 | $5,920 | $0 | $5,920 |
| 2014 | $2,245 | $8,880 | $0 | $8,880 |
Source: Public Records
Map
Nearby Homes
- 1573 Culbertson Ave Unit Emmens Preserve at T
- 1126 Prescott Cir
- 1517 Culbertson Ave
- 1575 Berkshire Ave
- 1641 Culbertson Ave
- 1464 Culbertson Ave
- 2360 Heritage Loop Unit 2360
- 2464 Rock Dove Rd
- 981 Mourning Dove Dr
- 993 Mourning Dove Dr
- 2331 Heritage Loop
- 2347 Heritage Loop
- 1185 Parish Way
- 1189 Wyatt Ln
- 1178 Shire Way
- 1829 Culbertson Ave
- 1857 Culbertson Ave Unit 1857
- 1869 Culbertson Ave Unit 1869
- 1192 Culbertson Ave
- 2006 Heritage Loop
- 1401 Thames Ct Unit EPA 275 Crepe Myrtle
- 1405 Thames Ct
- 1405 Thames Ct Unit Lot 274 Aster B
- 1409 Thames Ct
- 1409 Thames Ct Unit EPA 273 Crepe Myrtle
- 1409 Thames Ct
- 1413 Thames Ct Unit Brittany Park
- 1413 Thames Ct
- 1400 Thames Ct Unit EPA 246 Crepe Myrtle
- 1404 Thames Ct Unit EPA 247 Crepe Myrtle
- 1429 Beaumont Way
- 1408 Thames Ct
- 1408 Thames Ct Unit Lot 248 Aster A
- 1417 Thames Ct
- 1417 Thames Ct Unit EPA 271 Crepe Myrtle
- 1412 Thames Ct
- 1412 Thames Ct
- 1412 Thames Ct Unit EPA 249 Elem B
- 1412 Thames Ct
- 1553 Culbertson Ave