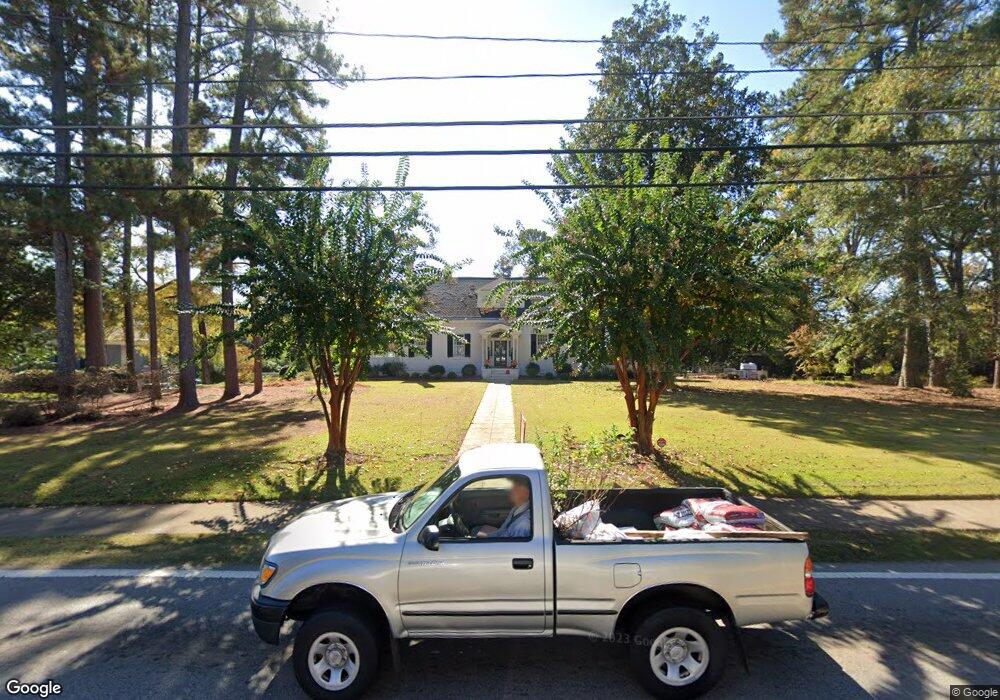
1401 Vernon St Lagrange, GA 30240
Estimated Value: $526,000 - $718,317
5
Beds
3
Baths
3,806
Sq Ft
$167/Sq Ft
Est. Value
About This Home
This home is located at 1401 Vernon St, Lagrange, GA 30240 and is currently estimated at $637,106, approximately $167 per square foot. 1401 Vernon St is a home located in Troup County with nearby schools including Ethel W. Kight Elementary School, Hollis Hand Elementary School, and Franklin Forest Elementary School.
Ownership History
Date
Name
Owned For
Owner Type
Purchase Details
Closed on
Apr 30, 2008
Sold by
Langford Phil
Bought by
Burch Robert Lee and Deriso Kim
Current Estimated Value
Home Financials for this Owner
Home Financials are based on the most recent Mortgage that was taken out on this home.
Original Mortgage
$295,000
Outstanding Balance
$184,122
Interest Rate
5.86%
Mortgage Type
New Conventional
Estimated Equity
$452,984
Purchase Details
Closed on
Mar 22, 1996
Sold by
Don R Marlowe
Bought by
Harriet Phil and Harriet Langford
Purchase Details
Closed on
Sep 4, 1986
Sold by
Overall Jerry M and Overall Juanita C
Bought by
Don R Marlowe
Purchase Details
Closed on
Aug 18, 1977
Sold by
Jim P Meadows
Bought by
Overall Jerry M and Overall Juanita C
Purchase Details
Closed on
Nov 3, 1975
Bought by
Jim P Meadows
Purchase Details
Closed on
Nov 1, 1926
Create a Home Valuation Report for This Property
The Home Valuation Report is an in-depth analysis detailing your home's value as well as a comparison with similar homes in the area
Purchase History
| Date | Buyer | Sale Price | Title Company |
|---|---|---|---|
| Burch Robert Lee | $465,000 | -- | |
| Harriet Phil | $269,000 | -- | |
| Don R Marlowe | $189,500 | -- | |
| Overall Jerry M | $98,000 | -- | |
| Jim P Meadows | $60,000 | -- | |
| -- | -- | -- |
Source: Public Records
Mortgage History
| Date | Status | Borrower | Loan Amount |
|---|---|---|---|
| Open | Burch Robert Lee | $295,000 |
Source: Public Records
Tax History
| Year | Tax Paid | Tax Assessment Tax Assessment Total Assessment is a certain percentage of the fair market value that is determined by local assessors to be the total taxable value of land and additions on the property. | Land | Improvement |
|---|---|---|---|---|
| 2025 | $7,306 | $280,080 | $67,840 | $212,240 |
| 2024 | $6,802 | $251,400 | $67,840 | $183,560 |
| 2023 | $6,714 | $248,160 | $67,840 | $180,320 |
| 2022 | $6,604 | $238,600 | $67,840 | $170,760 |
| 2021 | $5,263 | $176,480 | $31,520 | $144,960 |
| 2020 | $5,263 | $176,480 | $31,520 | $144,960 |
| 2019 | $5,173 | $173,520 | $31,520 | $142,000 |
| 2018 | $5,161 | $173,120 | $24,000 | $149,120 |
| 2017 | $5,161 | $173,120 | $24,000 | $149,120 |
| 2016 | $5,377 | $180,258 | $24,000 | $156,258 |
| 2015 | $5,614 | $187,813 | $31,555 | $156,258 |
| 2014 | $4,686 | $180,372 | $31,555 | $148,817 |
| 2013 | -- | $178,154 | $31,555 | $146,599 |
Source: Public Records
Map
Nearby Homes
- 0 N Lee St Unit 10550825
- 217 Jefferson St
- 211 Moores Hill
- 0 Moores Hill
- 107 Clark St
- 503 S Lee St
- 507 S Lee St
- 517 Jefferson St
- 119 College Ave
- 202 Parker Ln
- 421 College Ave
- 608 Wilburn Ave
- 610 Wilburn Ave
- 416 Park Ave
- 109 Garfield St
- 203 Waverly Way
- 304 Boulevard
- 208 Boulevard
- 216 E Lane Cir
- 600 Park Ave
- 1315 Vernon St
- 1403 Vernon St
- 1315 Vernon Rd
- 1313 Vernon St
- 1405 Vernon St
- 1400 Vernon St
- 1311 Vernon St
- 1307 Vernon St
- 1402 Vernon St
- 1310 Vernon St
- 206 N Lee St
- 202 N Lee St
- 210 N Lee St
- 1305 A & B Vernon St
- 1305 Vernon St Unit B
- 1305 Vernon St Unit A
- 1305 Vernon St
- 108 Ferrell Dr
- 304 N Lee St
- 302 N Lee St
Your Personal Tour Guide
Ask me questions while you tour the home.