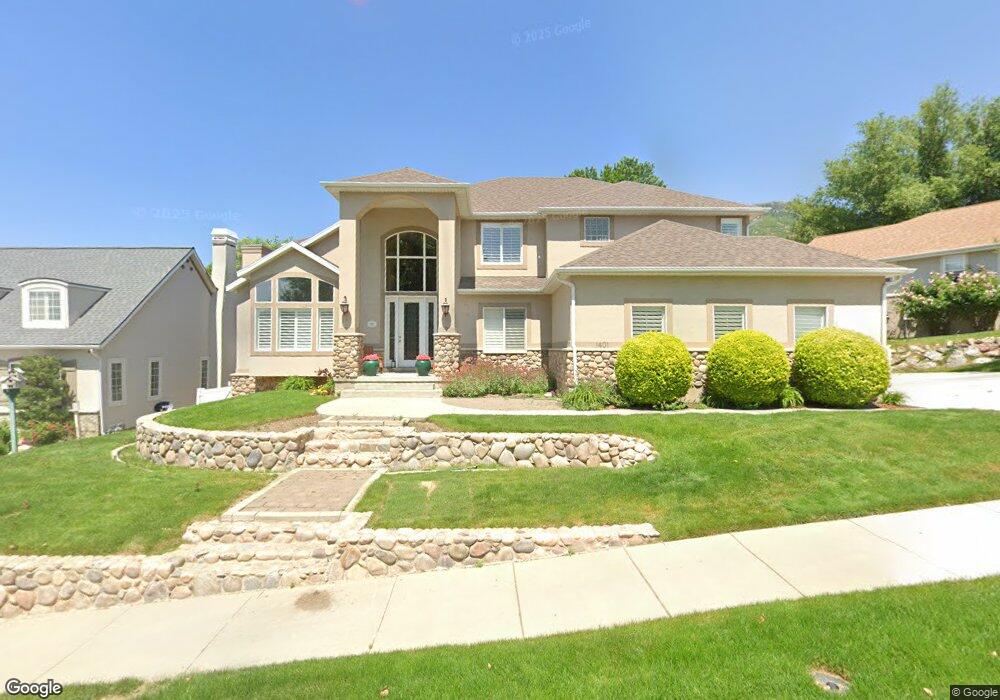
1401 Vestry Cir Draper, UT 84020
Estimated Value: $902,771 - $1,078,000
4
Beds
4
Baths
3,388
Sq Ft
$300/Sq Ft
Est. Value
About This Home
This home is located at 1401 Vestry Cir, Draper, UT 84020 and is currently estimated at $1,015,193, approximately $299 per square foot. 1401 Vestry Cir is a home located in Salt Lake County with nearby schools including Oak Hollow School, Draper Park Middle School, and Corner Canyon High School.
Ownership History
Date
Name
Owned For
Owner Type
Purchase Details
Closed on
May 8, 2001
Sold by
Novastar Mtg
Bought by
Wilson Jimmy B and Wilson Michelle R
Current Estimated Value
Home Financials for this Owner
Home Financials are based on the most recent Mortgage that was taken out on this home.
Original Mortgage
$330,000
Outstanding Balance
$172,610
Interest Rate
12.7%
Estimated Equity
$842,583
Purchase Details
Closed on
Apr 25, 2001
Sold by
Wilson Jimmy B and Wilson Michele R
Bought by
Novastar Mtg Inc
Home Financials for this Owner
Home Financials are based on the most recent Mortgage that was taken out on this home.
Original Mortgage
$330,000
Outstanding Balance
$172,610
Interest Rate
12.7%
Estimated Equity
$842,583
Purchase Details
Closed on
Aug 29, 1995
Sold by
South Mountain L C
Bought by
May Gregory K N
Create a Home Valuation Report for This Property
The Home Valuation Report is an in-depth analysis detailing your home's value as well as a comparison with similar homes in the area
Home Values in the Area
Average Home Value in this Area
Purchase History
| Date | Buyer | Sale Price | Title Company |
|---|---|---|---|
| Wilson Jimmy B | -- | America West Title | |
| Novastar Mtg Inc | $342,934 | Backman Stewart Title Servic | |
| May Gregory K N | -- | -- |
Source: Public Records
Mortgage History
| Date | Status | Borrower | Loan Amount |
|---|---|---|---|
| Open | Wilson Jimmy B | $330,000 |
Source: Public Records
Tax History
| Year | Tax Paid | Tax Assessment Tax Assessment Total Assessment is a certain percentage of the fair market value that is determined by local assessors to be the total taxable value of land and additions on the property. | Land | Improvement |
|---|---|---|---|---|
| 2025 | $3,883 | $814,000 | $256,700 | $557,300 |
| 2024 | $3,883 | $741,800 | $246,200 | $495,600 |
| 2023 | $3,755 | $712,000 | $230,300 | $481,700 |
| 2022 | $3,840 | $703,400 | $225,800 | $477,600 |
| 2021 | $3,935 | $584,000 | $183,800 | $400,200 |
| 2020 | $3,969 | $537,000 | $162,800 | $374,200 |
| 2019 | $3,970 | $524,900 | $162,800 | $362,100 |
| 2016 | $3,587 | $446,800 | $143,000 | $303,800 |
Source: Public Records
Map
Nearby Homes
- 1566 Fairway Ridge Rd
- 13454 Tuscalee Way
- 13307 S 1300 E
- 13543 S Aintree Ave
- 13456 S Aintree Ave
- 1287 E Corner View Ct
- 14032 Canyon Vista Ln
- 1209 E Bear Hollow Cove
- 13177 S Shadowlands Ln
- 14116 S Timber Ridge Dr
- 14078 Canyon Vista Ln
- 14133 S Spyglass Hill Dr
- 14146 S Spyglass Hill Dr
- 1549 E Patterson Ln
- 963 Old English Rd
- 1083 Skyler Dr E
- 13216 S Telemark Ln
- 919 E 13800 S
- 14082 S Pepi Band Rd
- 14249 S Canyon Vine Cove
- 1391 E Vestry Cir
- 1391 Vestry Cir
- 1413 Vestry Cir
- 1413 E Vestry Cir
- 1422 Annie Lace Way
- 1422 E Annie Lace Way
- 1432 Annie Lace Way
- 13639 Vestry Rd
- 13639 S Vestry Rd
- 1396 Vestry Cir
- 1432 E Annie Lace Way
- 1396 E Vestry Cir
- 1417 Vestry Cir
- 1417 E Vestry Cir
- 13671 Vestry Rd
- 13671 S Vestry Rd
- 1402 E Vestry Cir
- 1402 Vestry Cir
- 1402 Vestry Cir Unit 144
- 13666 Annie Lace Way
Your Personal Tour Guide
Ask me questions while you tour the home.