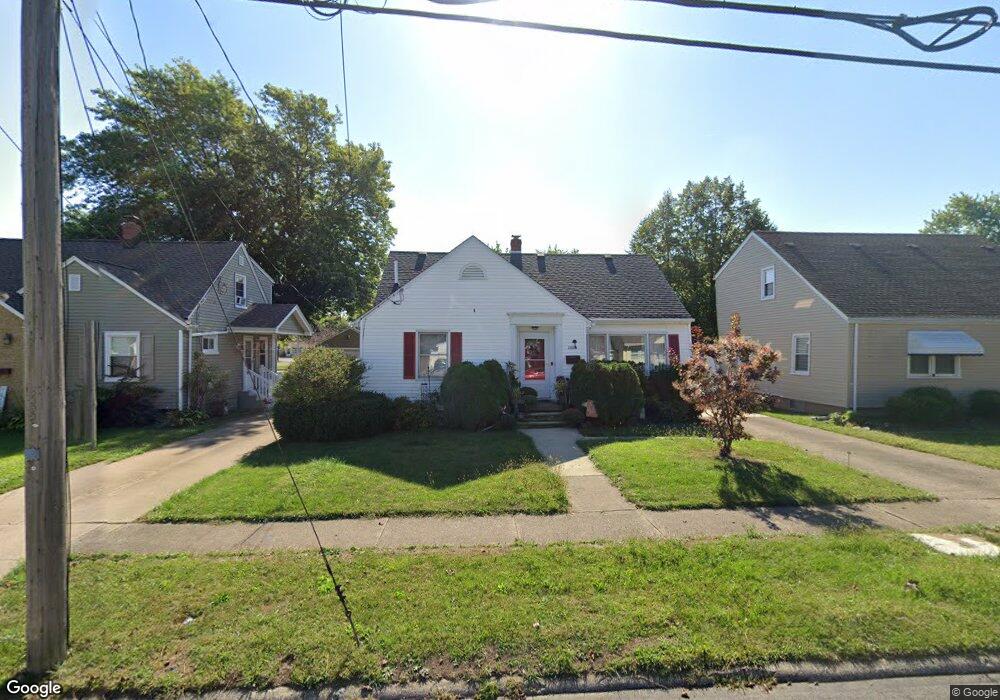
1402 Avondale St Sandusky, OH 44870
Estimated Value: $122,000 - $187,000
4
Beds
3
Baths
1,844
Sq Ft
$92/Sq Ft
Est. Value
About This Home
This home is located at 1402 Avondale St, Sandusky, OH 44870 and is currently estimated at $168,997, approximately $91 per square foot. 1402 Avondale St is a home located in Erie County with nearby schools including Sandusky High School, Monroe Preparatory Academy, and Sandusky Central Catholic School.
Ownership History
Date
Name
Owned For
Owner Type
Purchase Details
Closed on
Nov 14, 2014
Sold by
Luttman Michael
Bought by
Luttman Donna
Current Estimated Value
Purchase Details
Closed on
Feb 3, 2009
Sold by
Deutsche Bank National Trust Company
Bought by
Luttman Michael and Luttman Donna
Home Financials for this Owner
Home Financials are based on the most recent Mortgage that was taken out on this home.
Original Mortgage
$12,500
Interest Rate
8%
Mortgage Type
Purchase Money Mortgage
Purchase Details
Closed on
Mar 7, 2008
Sold by
Farrell Paula I
Bought by
Deutsche Bank National Trust Co
Purchase Details
Closed on
Jun 23, 2000
Sold by
Sieb Thomas A
Bought by
Farrell Robert L Paula I
Home Financials for this Owner
Home Financials are based on the most recent Mortgage that was taken out on this home.
Original Mortgage
$95,092
Interest Rate
8.56%
Mortgage Type
FHA
Create a Home Valuation Report for This Property
The Home Valuation Report is an in-depth analysis detailing your home's value as well as a comparison with similar homes in the area
Home Values in the Area
Average Home Value in this Area
Purchase History
| Date | Buyer | Sale Price | Title Company |
|---|---|---|---|
| Luttman Donna | -- | None Available | |
| Luttman Michael | $49,900 | -- | |
| Deutsche Bank National Trust Co | $104,495 | None Available | |
| Farrell Robert L Paula I | $95,200 | -- |
Source: Public Records
Mortgage History
| Date | Status | Borrower | Loan Amount |
|---|---|---|---|
| Previous Owner | Luttman Michael | $12,500 | |
| Previous Owner | Farrell Robert L Paula I | $95,092 |
Source: Public Records
Tax History Compared to Growth
Tax History
| Year | Tax Paid | Tax Assessment Tax Assessment Total Assessment is a certain percentage of the fair market value that is determined by local assessors to be the total taxable value of land and additions on the property. | Land | Improvement |
|---|---|---|---|---|
| 2024 | $1,718 | $44,624 | $6,926 | $37,698 |
| 2023 | $1,718 | $41,485 | $5,330 | $36,155 |
| 2022 | $2,054 | $41,481 | $5,330 | $36,151 |
| 2021 | $2,073 | $41,480 | $5,330 | $36,150 |
| 2020 | $2,010 | $36,980 | $5,330 | $31,650 |
| 2019 | $2,067 | $36,980 | $5,330 | $31,650 |
| 2018 | $2,070 | $36,980 | $5,330 | $31,650 |
| 2017 | $2,076 | $36,980 | $10,350 | $26,630 |
| 2016 | $2,075 | $36,980 | $10,350 | $26,630 |
| 2015 | $1,873 | $36,980 | $10,350 | $26,630 |
| 2014 | $2,322 | $44,260 | $10,350 | $33,910 |
| 2013 | $2,267 | $44,260 | $10,350 | $33,910 |
Source: Public Records
Map
Nearby Homes
- 1304 E Parish St
- 1419 Erie Blvd
- 1401 Mckinley St
- 1119 E Parish St
- 1648 Oakmont Ln
- 1665 Oakmont Ln
- 1104 Waverly Rd
- 319 E Parish St
- 1230 5th St
- 313 42nd St
- 301 E Parish St
- 216 E Follett St
- 1113 Ogontz St
- 1311 Franklin St
- 314 48th St
- 1003 5th St
- 315 50th St
- 2038 Columbus Ave
- 910 Ogontz St
- 2130 Columbus Ave
- 1346 Avondale St
- 1406 Avondale St
- 1342 Avondale St
- 1410 Avondale St
- 1414 Avondale St
- 1338 Avondale St
- 1401 Avondale St
- 1345 Avondale St
- 1405 Avondale St
- 1409 Avondale St
- 1341 Avondale St
- 1418 Avondale St
- 1334 Avondale St
- 1413 Avondale St
- 1422 Avondale St
- 1417 Avondale St
- 1333 Avondale St
- 1330 Avondale St
- 1421 Avondale St
- 1426 Avondale St