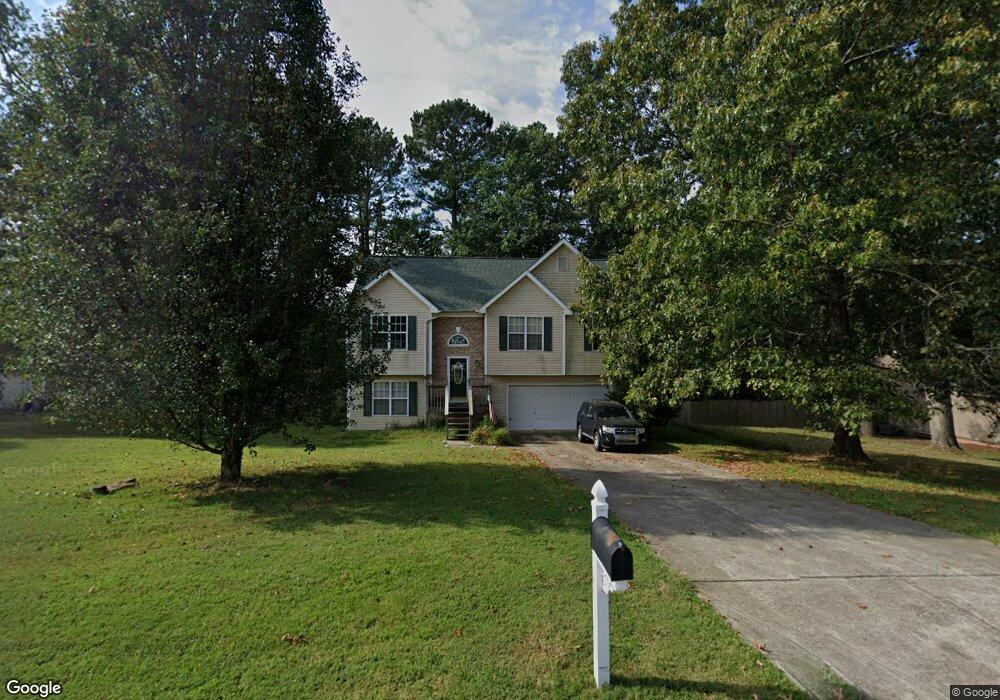
1402 Elliotts Ln Auburn, GA 30011
Estimated Value: $339,579 - $366,000
3
Beds
3
Baths
2,087
Sq Ft
$171/Sq Ft
Est. Value
About This Home
This home is located at 1402 Elliotts Ln, Auburn, GA 30011 and is currently estimated at $357,395, approximately $171 per square foot. 1402 Elliotts Ln is a home located in Barrow County with nearby schools including Auburn Elementary School, Westside Middle School, and Apalachee High School.
Ownership History
Date
Name
Owned For
Owner Type
Purchase Details
Closed on
Aug 17, 2007
Sold by
Johnson Michael L and Johnson Charlotte A
Bought by
Weaver Cynthia G and Weaver Jackie
Current Estimated Value
Home Financials for this Owner
Home Financials are based on the most recent Mortgage that was taken out on this home.
Original Mortgage
$151,387
Interest Rate
6.41%
Mortgage Type
FHA
Purchase Details
Closed on
Jul 6, 1999
Sold by
Appco Ent Inc
Bought by
Johnson Michael L and Johnson Charlotte A
Home Financials for this Owner
Home Financials are based on the most recent Mortgage that was taken out on this home.
Original Mortgage
$120,183
Interest Rate
7.65%
Mortgage Type
FHA
Purchase Details
Closed on
Feb 25, 1999
Sold by
Bagwell Development
Bought by
Appco Enterprises In
Purchase Details
Closed on
Jul 21, 1998
Bought by
Bagwell Development
Create a Home Valuation Report for This Property
The Home Valuation Report is an in-depth analysis detailing your home's value as well as a comparison with similar homes in the area
Home Values in the Area
Average Home Value in this Area
Purchase History
| Date | Buyer | Sale Price | Title Company |
|---|---|---|---|
| Weaver Cynthia G | $157,000 | -- | |
| Johnson Michael L | $121,800 | -- | |
| Appco Enterprises In | $500,000 | -- | |
| Bagwell Development | -- | -- |
Source: Public Records
Mortgage History
| Date | Status | Borrower | Loan Amount |
|---|---|---|---|
| Previous Owner | Weaver Cynthia G | $151,387 | |
| Previous Owner | Johnson Michael L | $120,183 |
Source: Public Records
Tax History Compared to Growth
Tax History
| Year | Tax Paid | Tax Assessment Tax Assessment Total Assessment is a certain percentage of the fair market value that is determined by local assessors to be the total taxable value of land and additions on the property. | Land | Improvement |
|---|---|---|---|---|
| 2024 | $2,403 | $98,335 | $21,200 | $77,135 |
| 2023 | $1,995 | $98,735 | $21,200 | $77,535 |
| 2022 | $2,727 | $97,148 | $21,200 | $75,948 |
| 2021 | $2,089 | $70,593 | $14,000 | $56,593 |
| 2020 | $2,090 | $70,593 | $14,000 | $56,593 |
| 2019 | $2,126 | $70,593 | $14,000 | $56,593 |
| 2018 | $1,909 | $64,292 | $12,000 | $52,292 |
| 2017 | $1,517 | $52,092 | $10,000 | $42,092 |
| 2016 | $1,316 | $45,850 | $12,000 | $33,850 |
| 2015 | $1,334 | $46,236 | $12,000 | $34,236 |
| 2014 | $1,185 | $40,992 | $6,370 | $34,622 |
| 2013 | -- | $38,486 | $6,370 | $32,116 |
Source: Public Records
Map
Nearby Homes
- 1226 Summer Ln
- 1054 Iron Wood Ct
- 1438 Elliotts Ln
- 1197 Dee Kennedy Rd
- 1329 Harmony Grove Church Rd
- 0 Dee Kennedy Rd Unit 10591909
- 0 Dee Kennedy Rd Unit 7638996
- 1037 Rolling Ridge Ln
- 1380 Cronic Town Rd
- 1420 Flanagan Mill Dr
- 1453 Dee Kennedy Rd
- 1035 Fleeman Rd
- 2417 Sunflower Dr
- 101 Deer Canyon Dr
- 51 Deer Canyon Dr
- 37 Deer Canyon Dr
- 23 Deer Canyon Dr
- 83 Deer Canyon Dr
- 1408 Elliotts Ln
- 1405 Elliotts Ln
- 1187 Harmony Grove Church Rd
- 1403 Elliotts Ln
- 1407 Elliotts Ln
- 1410 Elliotts Ln
- 1401 Elliotts Ln
- 0 Elliotts Ln Unit 8679908
- 0 Elliotts Ln Unit 8418329
- 0 Elliotts Ln Unit 8387527
- 0 Elliotts Ln Unit 8760751
- 0 Elliotts Ln Unit 8876405
- 0 Elliotts Ln Unit 3087471
- 0 Elliotts Ln Unit 3155110
- 0 Elliotts Ln Unit 3179936
- 0 Elliotts Ln Unit 7114394
- 0 Elliotts Ln Unit 7186218
- 0 Elliotts Ln
- 1409 Elliotts Ln
- 1203 Harmony Grove Church Rd Unit A