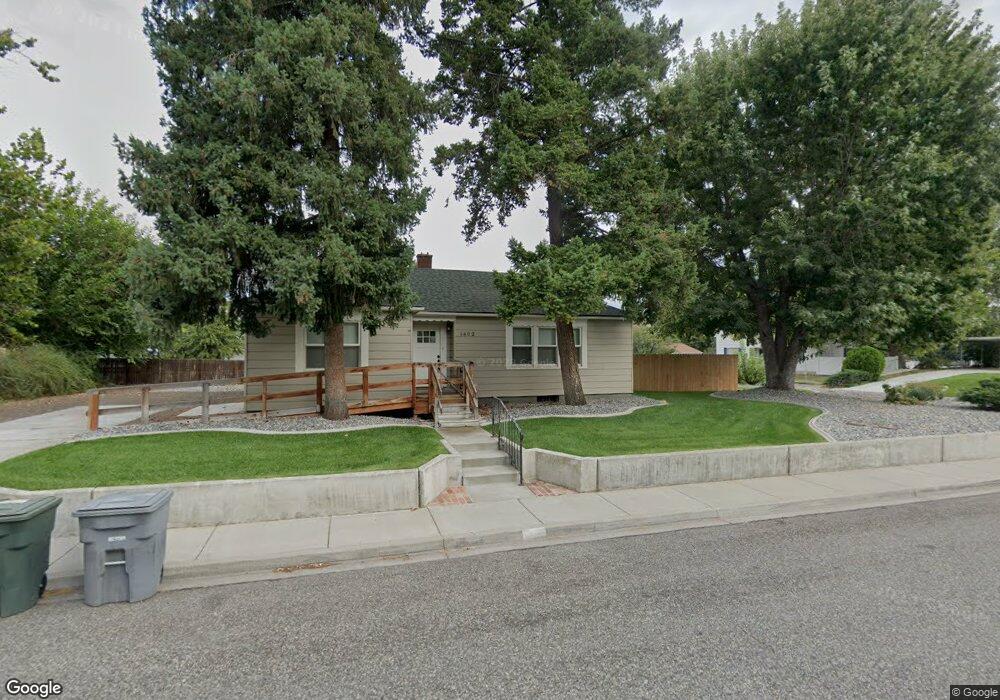
1402 Kimball Ave Richland, WA 99354
Estimated Value: $299,000 - $384,000
3
Beds
2
Baths
1,198
Sq Ft
$275/Sq Ft
Est. Value
About This Home
This home is located at 1402 Kimball Ave, Richland, WA 99354 and is currently estimated at $329,055, approximately $274 per square foot. 1402 Kimball Ave is a home located in Benton County with nearby schools including Jefferson Elementary School, Chief Joseph Middle School, and Richland High School.
Ownership History
Date
Name
Owned For
Owner Type
Purchase Details
Closed on
Jul 2, 2018
Sold by
Northern Lights Rental Properties Llc and Shay Johnson Susan
Bought by
Lights One Llc
Current Estimated Value
Purchase Details
Closed on
Jun 21, 2016
Sold by
Johnson Dean R and Shay Johnson Susan
Bought by
Northern Lights Rental Properties Llc
Purchase Details
Closed on
Mar 21, 2012
Sold by
Northern Lights Rental Properties Llc
Bought by
Johnson Dean R and Johnson Susan Shay
Purchase Details
Closed on
Sep 27, 2011
Sold by
Johnson Dean R and Shay Johnson Susan
Bought by
Northern Lights Rental Properties Llc
Purchase Details
Closed on
Mar 29, 2006
Sold by
The Heirs & Devicees Of William Sutton and Keene Betty S
Bought by
Johnson Dean and Shay Johnson Susan
Home Financials for this Owner
Home Financials are based on the most recent Mortgage that was taken out on this home.
Original Mortgage
$68,800
Interest Rate
6.25%
Mortgage Type
Fannie Mae Freddie Mac
Create a Home Valuation Report for This Property
The Home Valuation Report is an in-depth analysis detailing your home's value as well as a comparison with similar homes in the area
Home Values in the Area
Average Home Value in this Area
Purchase History
| Date | Buyer | Sale Price | Title Company |
|---|---|---|---|
| Lights One Llc | -- | None Available | |
| Northern Lights Rental Properties Llc | -- | None Available | |
| Johnson Dean R | -- | None Available | |
| Northern Lights Rental Properties Llc | -- | None Available | |
| Johnson Dean | $86,000 | Chicago Title |
Source: Public Records
Mortgage History
| Date | Status | Borrower | Loan Amount |
|---|---|---|---|
| Previous Owner | Johnson Dean | $68,800 |
Source: Public Records
Tax History Compared to Growth
Tax History
| Year | Tax Paid | Tax Assessment Tax Assessment Total Assessment is a certain percentage of the fair market value that is determined by local assessors to be the total taxable value of land and additions on the property. | Land | Improvement |
|---|---|---|---|---|
| 2024 | $2,283 | $259,620 | $50,000 | $209,620 |
| 2023 | $2,283 | $241,390 | $50,000 | $191,390 |
| 2022 | $2,131 | $209,500 | $50,000 | $159,500 |
| 2021 | $1,955 | $191,270 | $50,000 | $141,270 |
| 2020 | $2,202 | $168,480 | $50,000 | $118,480 |
| 2019 | $1,863 | $179,770 | $24,000 | $155,770 |
| 2018 | $1,790 | $163,660 | $24,000 | $139,660 |
| 2017 | $1,569 | $131,430 | $24,000 | $107,430 |
| 2016 | $1,547 | $131,430 | $24,000 | $107,430 |
| 2015 | $1,576 | $131,430 | $24,000 | $107,430 |
| 2014 | -- | $131,430 | $24,000 | $107,430 |
| 2013 | -- | $125,060 | $24,000 | $101,060 |
Source: Public Records
Map
Nearby Homes
- 1311 Goethals Dr Unit E
- 509 Taylor St
- 609 Torbett St
- 1509 Kimball Ave
- 1405 Marshall Ave
- 1511 Goethals Dr
- 1603 Mahan Ave
- 1609 Judson Ave
- 1116 Thayer Dr
- 1314 Potter Ave
- 1323 Potter Ave
- 1214 Potter Ave
- 947 Long Ave
- 1118 Potter Ave
- 1308 Swift Blvd
- 1509 Potter Ave
- 1510 Wilson St
- 1904 Thompson St
- 1002 Sanford Ave
- 2112-2114 Trippe St
- 718 Symons St
- 717 Taylor St
- 1403 Kimball Ave
- 719 Symons St
- 716 Symons St
- 802 Symons St
- 1405 Kimball Ave
- 1328 Kimball Ave
- 715 Taylor St
- 1403 Keller Ave
- 803 Symons St
- 1409 Kimball Ave
- 1327 Kimball Ave
- 1409 Keller Ave
- 1413 Kimball Ave
- 716 Taylor St
- 1404 Farrell Ln
- 804 Symons St
- 715 Symons St
- 1413 Kimball Ave