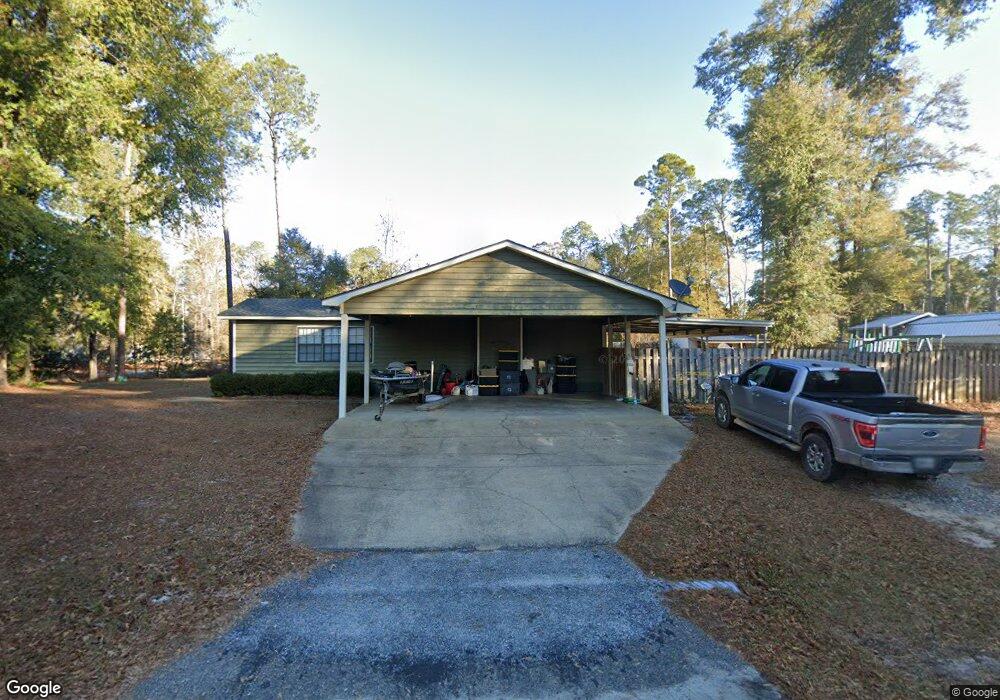
1402 Loblolly Ln Bainbridge, GA 39817
Estimated Value: $174,907 - $224,000
--
Bed
1
Bath
1,518
Sq Ft
$132/Sq Ft
Est. Value
About This Home
This home is located at 1402 Loblolly Ln, Bainbridge, GA 39817 and is currently estimated at $199,727, approximately $131 per square foot. 1402 Loblolly Ln is a home located in Decatur County with nearby schools including Bainbridge High School, Spring Creek Charter Academy, and Grace Christian Academy.
Ownership History
Date
Name
Owned For
Owner Type
Purchase Details
Closed on
Dec 29, 2009
Sold by
Hood Anthony L
Bought by
Hood Anthony L and Hood Freddie Lamar
Current Estimated Value
Home Financials for this Owner
Home Financials are based on the most recent Mortgage that was taken out on this home.
Original Mortgage
$138,747
Outstanding Balance
$93,603
Interest Rate
5.5%
Mortgage Type
FHA
Estimated Equity
$106,124
Purchase Details
Closed on
Dec 10, 2009
Sold by
Scott Martina B
Bought by
Hood Anthony L
Home Financials for this Owner
Home Financials are based on the most recent Mortgage that was taken out on this home.
Original Mortgage
$138,747
Outstanding Balance
$93,603
Interest Rate
5.5%
Mortgage Type
FHA
Estimated Equity
$106,124
Purchase Details
Closed on
Nov 22, 2005
Sold by
Sasser Sara Gay
Bought by
Hood Anthony L and Scott Hood Martina B
Home Financials for this Owner
Home Financials are based on the most recent Mortgage that was taken out on this home.
Original Mortgage
$139,313
Interest Rate
6.1%
Mortgage Type
FHA
Create a Home Valuation Report for This Property
The Home Valuation Report is an in-depth analysis detailing your home's value as well as a comparison with similar homes in the area
Home Values in the Area
Average Home Value in this Area
Purchase History
| Date | Buyer | Sale Price | Title Company |
|---|---|---|---|
| Hood Anthony L | -- | -- | |
| Hood Anthony L | -- | -- | |
| Hood Anthony L | $141,500 | -- |
Source: Public Records
Mortgage History
| Date | Status | Borrower | Loan Amount |
|---|---|---|---|
| Open | Hood Anthony L | $138,747 | |
| Closed | Hood Anthony L | $138,747 | |
| Previous Owner | Hood Anthony L | $139,313 |
Source: Public Records
Tax History Compared to Growth
Tax History
| Year | Tax Paid | Tax Assessment Tax Assessment Total Assessment is a certain percentage of the fair market value that is determined by local assessors to be the total taxable value of land and additions on the property. | Land | Improvement |
|---|---|---|---|---|
| 2024 | $1,746 | $57,007 | $6,700 | $50,307 |
| 2023 | $1,254 | $57,007 | $6,700 | $50,307 |
| 2022 | $1,704 | $57,007 | $6,700 | $50,307 |
| 2021 | $1,588 | $51,930 | $6,700 | $45,230 |
| 2020 | $1,471 | $45,726 | $6,700 | $39,026 |
| 2019 | $1,464 | $43,900 | $6,660 | $37,240 |
| 2018 | $1,447 | $43,900 | $6,660 | $37,240 |
| 2017 | $1,535 | $43,900 | $6,660 | $37,240 |
| 2016 | $1,475 | $43,900 | $6,660 | $37,240 |
| 2015 | $2,219 | $43,900 | $6,660 | $37,240 |
| 2014 | $2,057 | $63,394 | $9,657 | $53,736 |
| 2013 | -- | $63,393 | $9,657 | $53,736 |
Source: Public Records
Map
Nearby Homes
- 1302 Majestic Ave
- 1606 Hemlock St
- 000 E River Rd
- 1503 Smart St
- 1602 Belcher Ln
- 2032 Lexington Ave
- 2036 Lexington Ave
- 1001 Bluffton Dr
- 1103 Bluffton Dr
- 1000 E Gate Dr
- 927 5th Ave
- Lot 7 Easy Dr
- 705 N Lamar St
- 116 Rivervale Dr
- 1505 E Water St
- 1204 E Water St
- 1020 E Water St
- 836 Cooper St
- 287 Cloverleaf Cir
- 206 Plum Nelly Cir
- 1324 Loblolly Ln
- 1406 Loblolly Ln
- 1403 Jeffery Ln
- 1405 Jeffery Ln
- 1315 Jeffery Ln
- 1322 Loblolly Ln
- 1401 Loblolly Ln
- 1407 Jeffery Ln
- 1405 Loblolly Ln
- 1410 Loblolly Ln
- 1323 Loblolly Ln
- 1407 Loblolly Ln
- 1320 Loblolly Ln
- 1411 Jeffery Ln
- 1321 Loblolly Ln
- 1411 Loblolly Ln
- 1309 Jeffery Ln
- 1001 Mildred St
- 1602 Liz Felty Ln
- 1306 Loblolly Ln