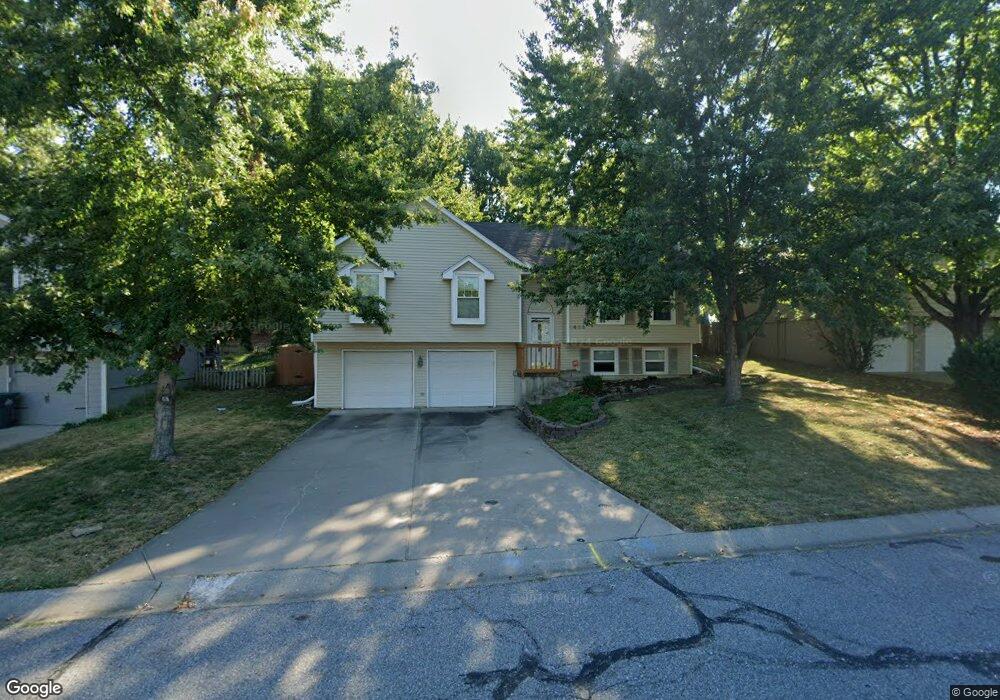
1402 NW Foxboro Rd Blue Springs, MO 64015
Estimated Value: $270,000 - $297,000
3
Beds
3
Baths
1,338
Sq Ft
$210/Sq Ft
Est. Value
About This Home
This home is located at 1402 NW Foxboro Rd, Blue Springs, MO 64015 and is currently estimated at $281,000, approximately $210 per square foot. 1402 NW Foxboro Rd is a home located in Jackson County with nearby schools including John Nowlin Elementary School, Paul Kinder Middle School, and Blue Springs High School.
Ownership History
Date
Name
Owned For
Owner Type
Purchase Details
Closed on
May 5, 2009
Sold by
Hsbc Mortgage Services Inc
Bought by
Jensen Marilyn J Etienne
Current Estimated Value
Home Financials for this Owner
Home Financials are based on the most recent Mortgage that was taken out on this home.
Original Mortgage
$103,588
Outstanding Balance
$64,919
Interest Rate
4.7%
Mortgage Type
FHA
Estimated Equity
$216,081
Purchase Details
Closed on
Sep 16, 2008
Sold by
Lafever Larry C
Bought by
Hsbc Mortgage Services Inc
Purchase Details
Closed on
Jun 6, 2005
Sold by
Lafever Joi D
Bought by
Lafever Larry C
Purchase Details
Closed on
Mar 11, 1998
Sold by
Henderson Gary M and Henderson Laurianne
Bought by
Lafever Joi D
Home Financials for this Owner
Home Financials are based on the most recent Mortgage that was taken out on this home.
Original Mortgage
$110,634
Interest Rate
7.13%
Mortgage Type
FHA
Create a Home Valuation Report for This Property
The Home Valuation Report is an in-depth analysis detailing your home's value as well as a comparison with similar homes in the area
Home Values in the Area
Average Home Value in this Area
Purchase History
| Date | Buyer | Sale Price | Title Company |
|---|---|---|---|
| Jensen Marilyn J Etienne | -- | First American Title | |
| Hsbc Mortgage Services Inc | $124,200 | First American Title Ins Co | |
| Lafever Larry C | -- | Ctic | |
| Lafever Joi D | -- | Old Republic Title |
Source: Public Records
Mortgage History
| Date | Status | Borrower | Loan Amount |
|---|---|---|---|
| Open | Jensen Marilyn J Etienne | $103,588 | |
| Previous Owner | Lafever Joi D | $110,634 |
Source: Public Records
Tax History Compared to Growth
Tax History
| Year | Tax Paid | Tax Assessment Tax Assessment Total Assessment is a certain percentage of the fair market value that is determined by local assessors to be the total taxable value of land and additions on the property. | Land | Improvement |
|---|---|---|---|---|
| 2025 | $3,570 | $42,214 | $6,268 | $35,946 |
| 2024 | $3,502 | $43,761 | $4,482 | $39,279 |
| 2023 | $3,502 | $43,760 | $4,742 | $39,018 |
| 2022 | $2,890 | $31,920 | $4,218 | $27,702 |
| 2021 | $3,179 | $35,150 | $4,218 | $30,932 |
| 2020 | $2,839 | $31,920 | $4,218 | $27,702 |
| 2019 | $2,744 | $35,020 | $4,218 | $30,802 |
| 2018 | $2,636 | $29,510 | $3,999 | $25,511 |
| 2017 | $2,375 | $29,510 | $3,999 | $25,511 |
| 2016 | $2,375 | $26,657 | $3,363 | $23,294 |
| 2014 | $2,117 | $23,692 | $3,505 | $20,187 |
Source: Public Records
Map
Nearby Homes
- 5200 NW Primrose Ct
- 5205 NW Primrose Ct
- 1401 NW Birdseye Ct
- 4508 NW Valley View Rd
- 1515 NW Primrose Ln
- 1204 NW 55th St
- 4301 NW Briarwood Dr
- 0 No Address Assigned By County N A Unit HMS2492165
- 4012 NW Delwood Ct
- 14 Emerald Shore Dr
- 405 Bellemere Rd
- 704 NW 39th St
- 22908 E 41st Terrace S
- 20912 E 50th Street Ct S
- 404 Countryside Rd
- 403 Countryside Rd
- 3605 NW Pier Ct
- 4075 SW M 7 Hwy
- The Wynn Plan at Sunny Pointe - Sunny Pointe Villas
- The Kinley Plan at Sunny Pointe - Sunny Pointe Villas
- 1404 NW Foxboro Rd
- 1400 NW Foxboro Rd
- 1406 NW Foxboro Rd
- 1405 NW 50th St
- 1401 NW 50th St
- 1409 NW 50th St
- 5010 NW Lamp Post Rd
- 1408 NW Foxboro Rd
- 1413 NW 50th St
- 3711 NW Valley View Rd
- 5014 NW Lamp Post Rd
- 1407 NW Foxboro Rd
- 1410 NW Foxboro Rd
- 1417 NW 50th St
- 5013 NW Lamp Post Rd
- 1409 NW Foxboro Rd
- 5018 NW Lamp Post Rd
- 4905 NW Valley View Rd
- 1404 NW Sandalwood Ct
- 1501 NW 50th St