Estimated Value: $161,686 - $189,000
2
Beds
1
Bath
960
Sq Ft
$180/Sq Ft
Est. Value
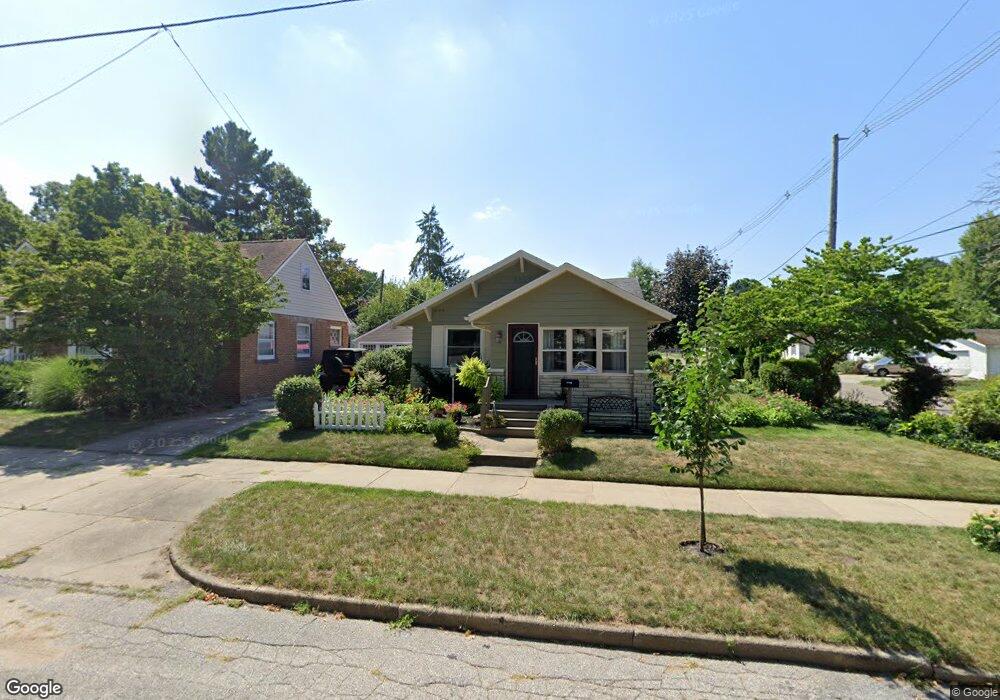
About This Home
This home is located at 1402 Regent St, Niles, MI 49120 and is currently estimated at $172,422, approximately $179 per square foot. 1402 Regent St is a home located in Berrien County with nearby schools including Ballard Elementary School, Oak Manor Sixth Grade Center, and Ring Lardner Middle School.
Ownership History
Date
Name
Owned For
Owner Type
Purchase Details
Closed on
Jan 19, 2018
Sold by
Coulston Gail A and Sabat Gail A
Bought by
Sabat Gail Ann and Sabat Chester J
Current Estimated Value
Home Financials for this Owner
Home Financials are based on the most recent Mortgage that was taken out on this home.
Original Mortgage
$58,500
Outstanding Balance
$41,273
Interest Rate
3.93%
Mortgage Type
New Conventional
Estimated Equity
$131,149
Purchase Details
Closed on
May 28, 1998
Purchase Details
Closed on
Mar 1, 1995
Purchase Details
Closed on
May 23, 1986
Purchase Details
Closed on
Nov 1, 1976
Create a Home Valuation Report for This Property
The Home Valuation Report is an in-depth analysis detailing your home's value as well as a comparison with similar homes in the area
Home Values in the Area
Average Home Value in this Area
Purchase History
| Date | Buyer | Sale Price | Title Company |
|---|---|---|---|
| Sabat Gail Ann | -- | None Available | |
| Sabat Gail Ann | -- | None Available | |
| -- | $59,900 | -- | |
| -- | $44,900 | -- | |
| -- | $39,900 | -- | |
| -- | $11,000 | -- |
Source: Public Records
Mortgage History
| Date | Status | Borrower | Loan Amount |
|---|---|---|---|
| Open | Sabat Gail Ann | $58,500 | |
| Closed | Sabat Gail Ann | $58,500 |
Source: Public Records
Tax History
| Year | Tax Paid | Tax Assessment Tax Assessment Total Assessment is a certain percentage of the fair market value that is determined by local assessors to be the total taxable value of land and additions on the property. | Land | Improvement |
|---|---|---|---|---|
| 2025 | $1,389 | $70,300 | $0 | $0 |
| 2024 | $1,088 | $59,100 | $0 | $0 |
| 2023 | $1,044 | $48,900 | $0 | $0 |
| 2022 | $994 | $38,700 | $0 | $0 |
| 2021 | $1,221 | $36,000 | $2,800 | $33,200 |
| 2020 | $1,208 | $34,300 | $0 | $0 |
| 2019 | $1,193 | $31,000 | $1,900 | $29,100 |
| 2018 | $1,153 | $31,000 | $0 | $0 |
| 2017 | $1,134 | $33,700 | $0 | $0 |
| 2016 | $1,110 | $31,300 | $0 | $0 |
| 2015 | $1,107 | $30,800 | $0 | $0 |
| 2014 | $863 | $28,900 | $0 | $0 |
Source: Public Records
Map
Nearby Homes
Your Personal Tour Guide
Ask me questions while you tour the home.