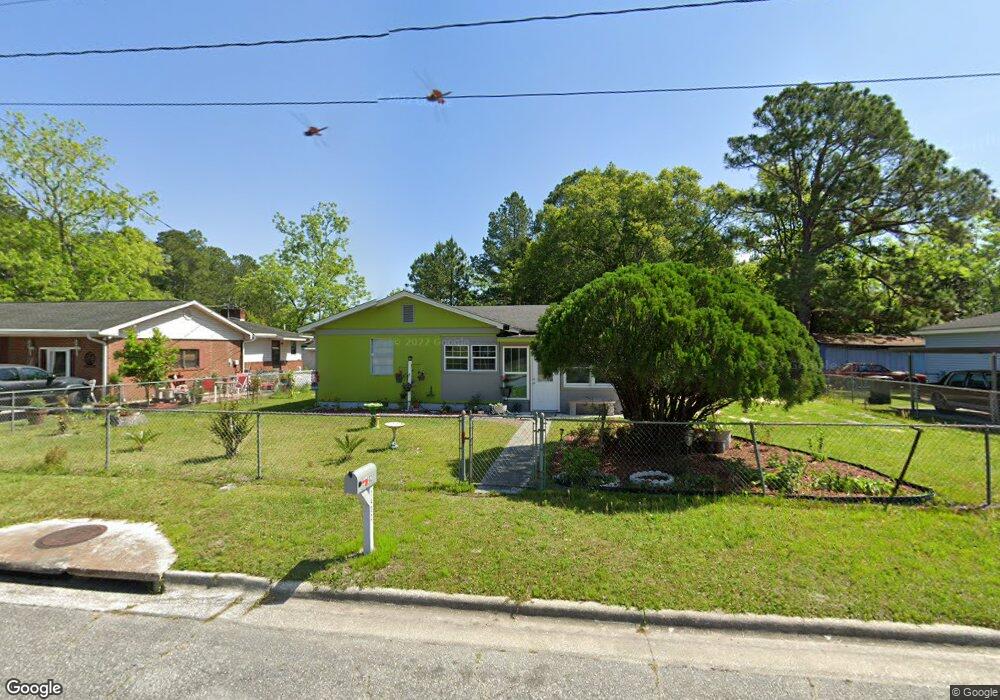
1402 Spence St Waycross, GA 31501
Estimated Value: $87,000 - $117,109
2
Beds
1
Bath
1,208
Sq Ft
$88/Sq Ft
Est. Value
About This Home
This home is located at 1402 Spence St, Waycross, GA 31501 and is currently estimated at $106,027, approximately $87 per square foot. 1402 Spence St is a home located in Ware County with nearby schools including Center Elementary School, Waycross Middle School, and Ware County High School.
Ownership History
Date
Name
Owned For
Owner Type
Purchase Details
Closed on
Feb 26, 2021
Sold by
Providence Assets Llc
Bought by
Ortiz Victor
Current Estimated Value
Purchase Details
Closed on
Sep 13, 2017
Bought by
Providence Assets Llc
Purchase Details
Closed on
Feb 27, 2017
Sold by
Providence Assets Llc
Bought by
Kingdom First Properties Llc
Purchase Details
Closed on
Aug 31, 2015
Sold by
Arns Inc
Bought by
Providence Assets Llc
Purchase Details
Closed on
Aug 10, 2015
Sold by
Christiana Trust /Tr
Bought by
Arns Inc
Purchase Details
Closed on
Oct 7, 2014
Sold by
Smith Larry
Bought by
Christiana Trust
Purchase Details
Closed on
May 18, 2006
Sold by
Burse Linda Denise
Bought by
Smith Larry and Smith Emma
Home Financials for this Owner
Home Financials are based on the most recent Mortgage that was taken out on this home.
Original Mortgage
$46,300
Interest Rate
6.44%
Mortgage Type
New Conventional
Purchase Details
Closed on
Sep 20, 2004
Sold by
Williams Bessie H
Bought by
Burse Linda D and Kim Wandell Steedle
Create a Home Valuation Report for This Property
The Home Valuation Report is an in-depth analysis detailing your home's value as well as a comparison with similar homes in the area
Home Values in the Area
Average Home Value in this Area
Purchase History
| Date | Buyer | Sale Price | Title Company |
|---|---|---|---|
| Ortiz Victor | $15,000 | -- | |
| Providence Assets Llc | $10,250 | -- | |
| Kingdom First Properties Llc | $1,000 | -- | |
| Providence Assets Llc | $10,800 | -- | |
| Arns Inc | -- | -- | |
| Christiana Trust | $32,000 | -- | |
| Smith Larry | $46,300 | -- | |
| Burse Linda D | -- | -- |
Source: Public Records
Mortgage History
| Date | Status | Borrower | Loan Amount |
|---|---|---|---|
| Previous Owner | Smith Larry | $46,300 |
Source: Public Records
Tax History Compared to Growth
Tax History
| Year | Tax Paid | Tax Assessment Tax Assessment Total Assessment is a certain percentage of the fair market value that is determined by local assessors to be the total taxable value of land and additions on the property. | Land | Improvement |
|---|---|---|---|---|
| 2024 | $1,351 | $38,192 | $2,160 | $36,032 |
| 2023 | $1,317 | $12,577 | $1,067 | $11,510 |
| 2022 | $501 | $12,577 | $1,067 | $11,510 |
| 2021 | $469 | $10,847 | $1,067 | $9,780 |
| 2020 | $465 | $10,667 | $1,067 | $9,600 |
| 2019 | $460 | $10,397 | $1,067 | $9,330 |
| 2018 | $444 | $9,946 | $1,067 | $8,879 |
| 2017 | $682 | $15,650 | $1,067 | $14,583 |
| 2016 | $682 | $15,650 | $1,067 | $14,583 |
| 2015 | $687 | $15,650 | $1,067 | $14,583 |
| 2014 | $686 | $15,650 | $1,067 | $14,583 |
| 2013 | -- | $15,650 | $1,066 | $14,583 |
Source: Public Records
Map
Nearby Homes