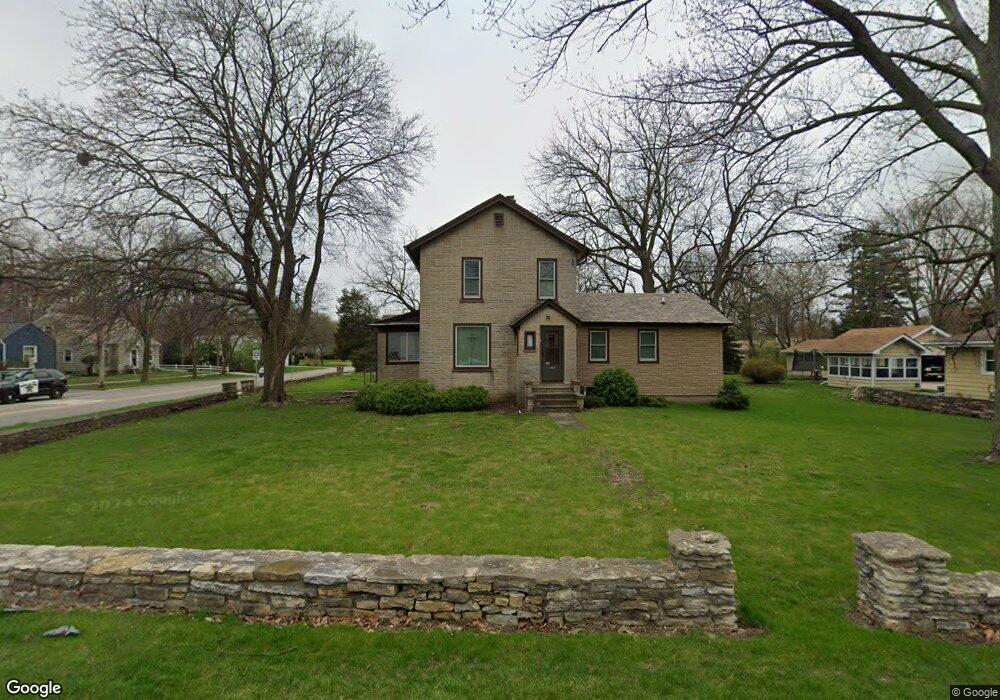
1402 W Galena Blvd Aurora, IL 60506
Blackhawk NeighborhoodEstimated Value: $361,000 - $434,000
3
Beds
3
Baths
2,529
Sq Ft
$159/Sq Ft
Est. Value
About This Home
This home is located at 1402 W Galena Blvd, Aurora, IL 60506 and is currently estimated at $402,495, approximately $159 per square foot. 1402 W Galena Blvd is a home located in Kane County with nearby schools including Freeman Elementary School, Washington Middle School, and West Aurora High School.
Ownership History
Date
Name
Owned For
Owner Type
Purchase Details
Closed on
Mar 19, 2025
Sold by
Hoper Clifford R
Bought by
Hoper Family Revocable Trust
Current Estimated Value
Purchase Details
Closed on
Oct 10, 2007
Sold by
Schindlbeck Steven J and Schindlbeck Pamela
Bought by
Hoper Clifford R and Hoper Ingrid L
Home Financials for this Owner
Home Financials are based on the most recent Mortgage that was taken out on this home.
Original Mortgage
$170,800
Interest Rate
6.44%
Mortgage Type
Purchase Money Mortgage
Purchase Details
Closed on
Jun 8, 2001
Sold by
Schindlbeck Steven J
Bought by
Schindlbeck Steven J and Schindlbeck Pamela
Home Financials for this Owner
Home Financials are based on the most recent Mortgage that was taken out on this home.
Original Mortgage
$98,500
Interest Rate
7.16%
Create a Home Valuation Report for This Property
The Home Valuation Report is an in-depth analysis detailing your home's value as well as a comparison with similar homes in the area
Home Values in the Area
Average Home Value in this Area
Purchase History
| Date | Buyer | Sale Price | Title Company |
|---|---|---|---|
| Hoper Family Revocable Trust | -- | None Listed On Document | |
| Hoper Clifford R | $213,500 | Multiple | |
| Schindlbeck Steven J | -- | First American |
Source: Public Records
Mortgage History
| Date | Status | Borrower | Loan Amount |
|---|---|---|---|
| Previous Owner | Hoper Clifford R | $170,800 | |
| Previous Owner | Schindlbeck Steven J | $98,500 |
Source: Public Records
Tax History Compared to Growth
Tax History
| Year | Tax Paid | Tax Assessment Tax Assessment Total Assessment is a certain percentage of the fair market value that is determined by local assessors to be the total taxable value of land and additions on the property. | Land | Improvement |
|---|---|---|---|---|
| 2024 | $8,904 | $128,450 | $19,878 | $108,572 |
| 2023 | $8,460 | $114,770 | $17,761 | $97,009 |
| 2022 | $8,296 | $104,717 | $16,205 | $88,512 |
| 2021 | $7,902 | $97,493 | $15,087 | $82,406 |
| 2020 | $7,448 | $90,557 | $14,014 | $76,543 |
| 2019 | $7,691 | $89,655 | $12,984 | $76,671 |
| 2018 | $7,170 | $82,820 | $12,010 | $70,810 |
| 2017 | $6,819 | $77,253 | $11,066 | $66,187 |
| 2016 | $6,147 | $68,866 | $9,486 | $59,380 |
| 2015 | -- | $60,631 | $8,157 | $52,474 |
| 2014 | -- | $57,964 | $7,497 | $50,467 |
| 2013 | -- | $63,142 | $7,541 | $55,601 |
Source: Public Records
Map
Nearby Homes
- 231 W Downer Place
- 1543 W Downer Place
- 149 S Gladstone Ave
- 113 Stonewood Place Unit 6D
- 164 S Calumet Ave
- 203 S Calumet Ave
- 630 N Buell Ave
- 1730 W Galena Blvd Unit 402E
- 1735 Greene Ct
- 1751 Greene Ct
- 930 W New York St Unit 932
- 931 W Downer Place
- 943 Charles St
- 237 Ingleside Ave
- 900 Charles St
- 850 W Galena Blvd
- 1747 W Illinois Ave
- 1351 Monomoy St Unit D
- 1389 Monomoy St Unit B2
- 175 S Harrison Ave
- 1426 W Galena Blvd
- 15 S Randall Rd
- 4 N Randall Rd
- 6 N Randall Rd
- 5 N Randall Rd
- 7 N Randall Rd
- 8 S Randall Rd
- 8 S Randall Rd
- 6 S Glenwood Place
- 1362 W Galena Blvd Unit A
- 1362 W Galena Blvd
- 16 S Glenwood Place
- 14 S Randall Rd
- 2 S Glenwood Place
- 20 S Glenwood Place
- 27 N Randall Rd
- 1405 W Downer Place
- 1415 W Downer Place
- 1361 W Downer Place
- 1421 W Downer Place