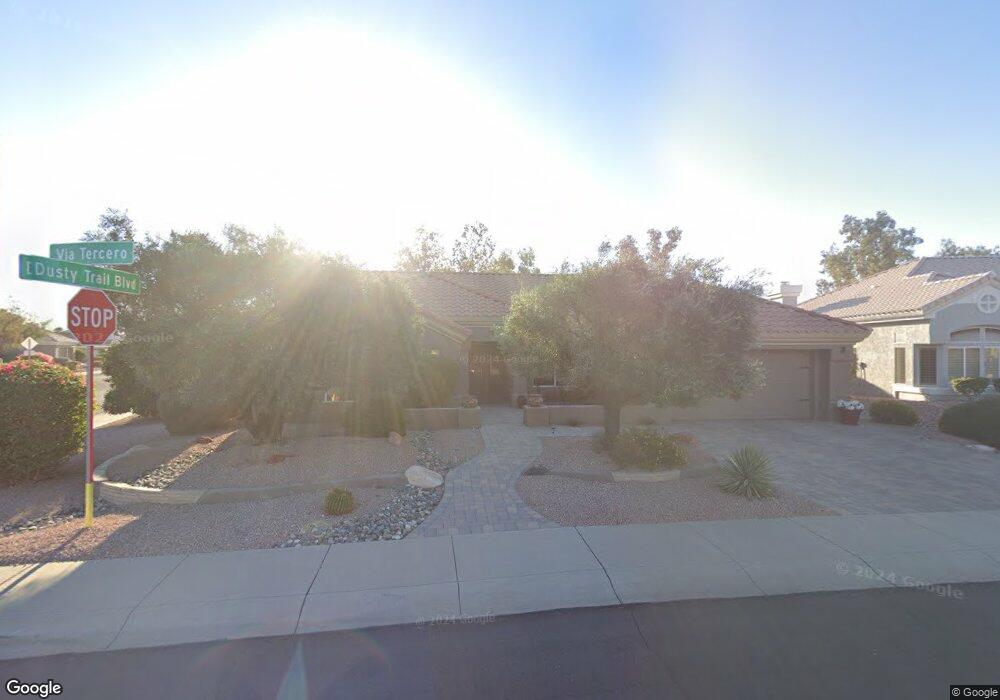
14029 W Via Tercero Sun City West, AZ 85375
Estimated Value: $411,914 - $489,000
--
Bed
2
Baths
1,669
Sq Ft
$269/Sq Ft
Est. Value
About This Home
This home is located at 14029 W Via Tercero, Sun City West, AZ 85375 and is currently estimated at $449,729, approximately $269 per square foot. 14029 W Via Tercero is a home located in Maricopa County with nearby schools including Asante Preparatory Academy, Cimarron Springs Middle School, and Willow Canyon High School.
Ownership History
Date
Name
Owned For
Owner Type
Purchase Details
Closed on
Sep 22, 2014
Sold by
Selander Dean L and Selander Jenine K
Bought by
Revo Dean L Selander and Revo Jenine K Selendar
Current Estimated Value
Purchase Details
Closed on
Jun 21, 2005
Sold by
Dejerf Karen L
Bought by
Selander Dean L and Selander Jenine K
Home Financials for this Owner
Home Financials are based on the most recent Mortgage that was taken out on this home.
Original Mortgage
$215,600
Outstanding Balance
$109,718
Interest Rate
5.37%
Mortgage Type
Purchase Money Mortgage
Estimated Equity
$340,011
Purchase Details
Closed on
Sep 18, 1998
Sold by
Messinger Lyle R
Bought by
Dejerf Karen L
Purchase Details
Closed on
May 17, 1994
Sold by
Del E Webb Development Co L P
Bought by
Messinger Lyle R
Create a Home Valuation Report for This Property
The Home Valuation Report is an in-depth analysis detailing your home's value as well as a comparison with similar homes in the area
Home Values in the Area
Average Home Value in this Area
Purchase History
| Date | Buyer | Sale Price | Title Company |
|---|---|---|---|
| Revo Dean L Selander | -- | None Available | |
| Selander Dean L | $269,500 | Equity Title Agency Inc | |
| Dejerf Karen L | $180,000 | First American Title | |
| Messinger Lyle R | $157,989 | Sun City Title Agency | |
| Del E Webb Development Co L P | -- | Sun City Title Agency Co |
Source: Public Records
Mortgage History
| Date | Status | Borrower | Loan Amount |
|---|---|---|---|
| Open | Selander Dean L | $215,600 |
Source: Public Records
Tax History Compared to Growth
Tax History
| Year | Tax Paid | Tax Assessment Tax Assessment Total Assessment is a certain percentage of the fair market value that is determined by local assessors to be the total taxable value of land and additions on the property. | Land | Improvement |
|---|---|---|---|---|
| 2025 | $3,251 | $31,864 | -- | -- |
| 2024 | $3,030 | $30,346 | -- | -- |
| 2023 | $3,030 | $36,480 | $7,290 | $29,190 |
| 2022 | $2,910 | $30,100 | $6,020 | $24,080 |
| 2021 | $3,017 | $27,830 | $5,560 | $22,270 |
| 2020 | $2,961 | $26,650 | $5,330 | $21,320 |
| 2019 | $2,886 | $24,300 | $4,860 | $19,440 |
| 2018 | $2,815 | $23,550 | $4,710 | $18,840 |
| 2017 | $2,702 | $22,450 | $4,490 | $17,960 |
| 2016 | $2,577 | $20,960 | $4,190 | $16,770 |
| 2015 | $2,385 | $19,870 | $3,970 | $15,900 |
Source: Public Records
Map
Nearby Homes
- 14101 W Vía Tercero
- 22836 N Dusty Trail Blvd
- 22610 N Cabana Ln Unit 52
- 14211 W Horizon Dr
- 22725 N Dusty Trail Blvd
- 14207 W Gunsight Dr
- 22721 N Dusty Trail Blvd
- 14209 W Territorial Ln
- 22608 N Dusty Trail Blvd
- 12656 W Country Club Trail
- 14317 W Robertson Dr
- 13811 W Vía Tercero
- 23105 N Drifter Way
- 14332 W Dusty Trail Blvd
- 23120 N Drifter Way
- 22318 N Dusty Trail Blvd Unit 51
- 14416 W Robertson Dr
- 14418 W Gunsight Dr Unit 53
- 14117 W Pecos Ln
- 13766 W Junipero Dr
- 14033 W Via Tercero
- 14052 W Dusty Trail Blvd
- 14102 W Via Tercero
- 14056 W Dusty Trail Blvd
- 14101 W Via Tercero
- 14060 W Dusty Trail Blvd
- 14106 W Via Tercero
- 22837 N Dusty Trail Blvd
- 22832 N Dusty Trail Blvd
- 14027 W Horizon Dr
- 14105 W Via Tercero
- 14103 W Dusty Trail Blvd
- 22833 N Dusty Trail Blvd
- 14110 W Via Tercero
- 14068 W Dusty Trail Blvd
- 22828 N Dusty Trail Blvd
- 12641 W Daley Ln
- 12649 W Daley Ln
- 14109 W Via Tercero