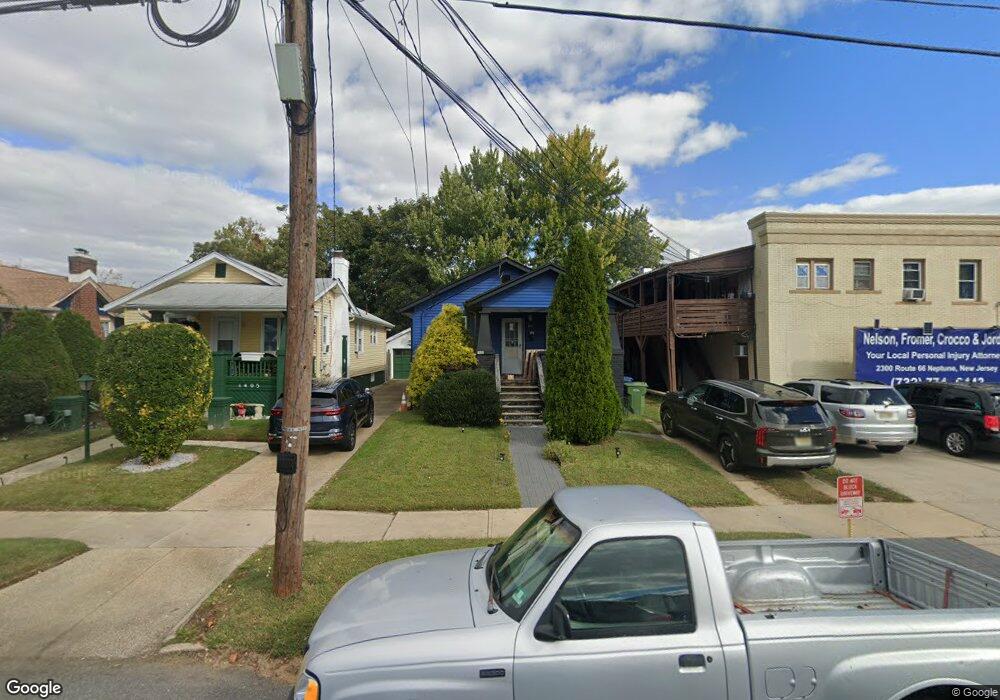
1403 8th Ave Neptune, NJ 07753
Estimated Value: $387,000 - $730,000
3
Beds
2
Baths
1,490
Sq Ft
$364/Sq Ft
Est. Value
About This Home
This home is located at 1403 8th Ave, Neptune, NJ 07753 and is currently estimated at $542,141, approximately $363 per square foot. 1403 8th Ave is a home located in Monmouth County with nearby schools including Neptune High School.
Ownership History
Date
Name
Owned For
Owner Type
Purchase Details
Closed on
Sep 19, 2002
Sold by
Shannon Peter
Bought by
Stafford Gregory and Lutz Barbara
Current Estimated Value
Home Financials for this Owner
Home Financials are based on the most recent Mortgage that was taken out on this home.
Original Mortgage
$237,500
Outstanding Balance
$99,284
Interest Rate
6.25%
Estimated Equity
$442,857
Purchase Details
Closed on
Oct 19, 2001
Sold by
Haar Michael
Bought by
Shannon Peter and Shannon Susan
Purchase Details
Closed on
Jan 27, 1998
Sold by
Mangold Robert
Bought by
Haar Michael
Home Financials for this Owner
Home Financials are based on the most recent Mortgage that was taken out on this home.
Original Mortgage
$120,000
Interest Rate
6.95%
Purchase Details
Closed on
Oct 22, 1993
Sold by
O'Brien Gael
Bought by
Mangold Robert
Home Financials for this Owner
Home Financials are based on the most recent Mortgage that was taken out on this home.
Original Mortgage
$129,000
Interest Rate
6.73%
Create a Home Valuation Report for This Property
The Home Valuation Report is an in-depth analysis detailing your home's value as well as a comparison with similar homes in the area
Home Values in the Area
Average Home Value in this Area
Purchase History
| Date | Buyer | Sale Price | Title Company |
|---|---|---|---|
| Stafford Gregory | $250,000 | -- | |
| Shannon Peter | $250,000 | -- | |
| Haar Michael | $150,000 | -- | |
| Mangold Robert | $126,500 | -- |
Source: Public Records
Mortgage History
| Date | Status | Borrower | Loan Amount |
|---|---|---|---|
| Open | Stafford Gregory | $237,500 | |
| Previous Owner | Haar Michael | $120,000 | |
| Previous Owner | Mangold Robert | $129,000 |
Source: Public Records
Tax History Compared to Growth
Tax History
| Year | Tax Paid | Tax Assessment Tax Assessment Total Assessment is a certain percentage of the fair market value that is determined by local assessors to be the total taxable value of land and additions on the property. | Land | Improvement |
|---|---|---|---|---|
| 2025 | $9,874 | $552,100 | $353,500 | $198,600 |
| 2024 | $9,720 | $563,900 | $369,000 | $194,900 |
| 2023 | $9,720 | $538,200 | $347,800 | $190,400 |
| 2022 | $7,974 | $442,300 | $261,000 | $181,300 |
| 2021 | $7,246 | $377,400 | $238,200 | $139,200 |
| 2020 | $7,305 | $344,900 | $213,000 | $131,900 |
| 2019 | $7,246 | $337,800 | $214,100 | $123,700 |
| 2018 | $6,935 | $319,600 | $196,800 | $122,800 |
| 2017 | $7,014 | $310,500 | $196,800 | $113,700 |
| 2016 | $6,426 | $283,700 | $171,800 | $111,900 |
| 2015 | $6,084 | $273,200 | $164,000 | $109,200 |
| 2014 | $6,019 | $222,200 | $114,000 | $108,200 |
Source: Public Records
Map
Nearby Homes
- 1409 7th Ave
- 1317 7th Ave
- 503 Ridge Ave
- 1329 6th Ave
- 601/603 Route 35
- 3 5th Ave Unit Residence 209
- 3 5th Ave Unit Residence 406
- 3 5th Ave Unit Residence 203
- 3 5th Ave Unit Residence 108
- 3 5th Ave Unit Residence 301
- 1221 11th Ave
- 45 Ridge Ave
- 152 Division St
- 55 N Route 35 Unit 12A
- 142 1/2 5th Ave Unit Residence 205
- 142 1/2 5th Ave Unit Residence 207
- 142 1/2 5th Ave Unit Residence 108
- 142 1/2 5th Ave Unit Residence 402
- 142 1/2 5th Ave Unit Residence 206
- 1501 Cherry Ln
- 1405 8th Ave
- 409 Highway 35 S
- 1407 8th Ave
- 503 Highway 35
- 403 State Route 35 S
- 1409 8th Ave
- 401 State Route 35 S
- 1411 8th Ave
- 1323 8th Ave
- 1404 8th Ave
- 501 Hwy 35 S
- 1413 8th Ave
- 503 New Jersey 35
- 503 State Route 35 S
- 1404 9th Ave
- 1406 9th Ave
- 1406 8th Ave
- 500 State Route 35 S
- 1415 8th Ave
- 505 State Route 35 S