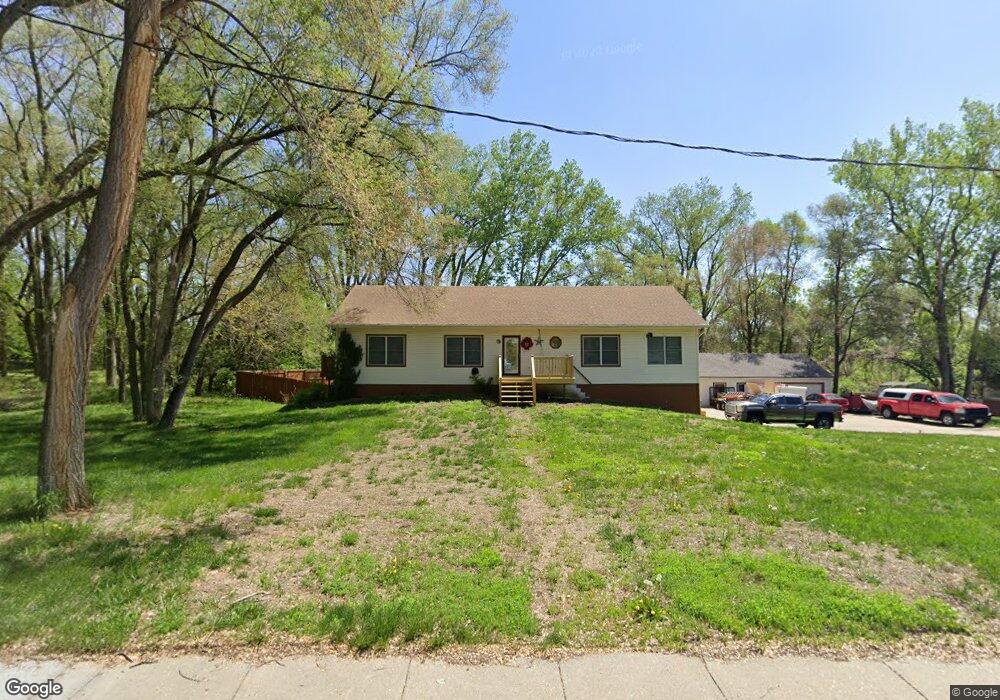
1403 Bluff St Bellevue, NE 68005
Estimated Value: $350,000 - $524,129
4
Beds
3
Baths
2,971
Sq Ft
$160/Sq Ft
Est. Value
About This Home
This home is located at 1403 Bluff St, Bellevue, NE 68005 and is currently estimated at $475,782, approximately $160 per square foot. 1403 Bluff St is a home located in Sarpy County with nearby schools including Bertha Barber Elementary School, Bellevue Mission Middle School, and Bellevue East High School.
Ownership History
Date
Name
Owned For
Owner Type
Purchase Details
Closed on
Mar 12, 2018
Sold by
Shea Stephen B
Bought by
Satacruz Gerardo Ramirez
Current Estimated Value
Home Financials for this Owner
Home Financials are based on the most recent Mortgage that was taken out on this home.
Original Mortgage
$299,250
Outstanding Balance
$256,555
Interest Rate
4.4%
Mortgage Type
New Conventional
Estimated Equity
$219,227
Purchase Details
Closed on
Jun 29, 2016
Sold by
Augustine Michael T
Bought by
Shea Stephen B
Home Financials for this Owner
Home Financials are based on the most recent Mortgage that was taken out on this home.
Original Mortgage
$222,000
Interest Rate
2.75%
Mortgage Type
Adjustable Rate Mortgage/ARM
Purchase Details
Closed on
Aug 10, 2010
Sold by
Augustine Nancy E
Bought by
Augustine Michael T
Create a Home Valuation Report for This Property
The Home Valuation Report is an in-depth analysis detailing your home's value as well as a comparison with similar homes in the area
Home Values in the Area
Average Home Value in this Area
Purchase History
| Date | Buyer | Sale Price | Title Company |
|---|---|---|---|
| Satacruz Gerardo Ramirez | $315,000 | Nebraska Land Title & Abstra | |
| Shea Stephen B | $278,000 | Dri Title & Escrow | |
| Augustine Michael T | -- | None Available |
Source: Public Records
Mortgage History
| Date | Status | Borrower | Loan Amount |
|---|---|---|---|
| Open | Satacruz Gerardo Ramirez | $299,250 | |
| Previous Owner | Shea Stephen B | $222,000 |
Source: Public Records
Tax History
| Year | Tax Paid | Tax Assessment Tax Assessment Total Assessment is a certain percentage of the fair market value that is determined by local assessors to be the total taxable value of land and additions on the property. | Land | Improvement |
|---|---|---|---|---|
| 2025 | $7,402 | $472,010 | $97,486 | $374,524 |
| 2024 | $8,000 | $422,750 | $81,238 | $341,512 |
| 2023 | $8,000 | $378,886 | $81,238 | $297,648 |
| 2022 | $7,091 | $329,486 | $64,920 | $264,566 |
| 2021 | $6,821 | $313,567 | $58,361 | $255,206 |
| 2020 | $6,541 | $299,740 | $58,361 | $241,379 |
| 2019 | $6,409 | $295,559 | $58,361 | $237,198 |
| 2018 | $5,647 | $267,431 | $58,361 | $209,070 |
| 2017 | $5,499 | $258,638 | $58,361 | $200,277 |
| 2016 | $4,943 | $237,584 | $56,780 | $180,804 |
| 2015 | $4,759 | $230,116 | $56,780 | $173,336 |
| 2014 | $4,700 | $225,757 | $56,780 | $168,977 |
| 2012 | -- | $219,610 | $56,780 | $162,830 |
Source: Public Records
Map
Nearby Homes
- 1404 Warren St
- 104 Waldo Cir
- 1801 Hancock St
- 1908 Warren St
- 1701 Jefferson St
- 1105 Kountze Memorial Dr
- 2004 Main St
- 1405 Freeman Dr
- 420 Waldruh Dr
- 2309 Main St
- 411 W 22nd Ave
- 1010 Bellevue Blvd S
- 2010 Jackson St
- 1807 Collins Dr
- 2405 Hancock St
- Lot 13 Hidden Hills Dr
- 504 Kountze Memorial Dr
- 2303 Madison St
- 2519 Hancock St
- 2510 Franklin St
- 1403 Bluff St
- 1409 Bluff St
- 1411 Bluff St
- 408 Robinson Ave
- 409 Robinson Ave
- 407 Robinson Ave
- 406 Robinson Ave
- 405 Robinson Ave
- 404 Robinson Ave
- 1500 Bluff St
- 401 E 16th St
- 1502 Bluff St
- 401 Robinson Ave
- 402 Robinson Ave
- 1315 Bluff St
- 1411 Warren St
- 1413 Warren St
- 1600 Front St
- 1501 Warren St
- 1509 Bluff St
Your Personal Tour Guide
Ask me questions while you tour the home.