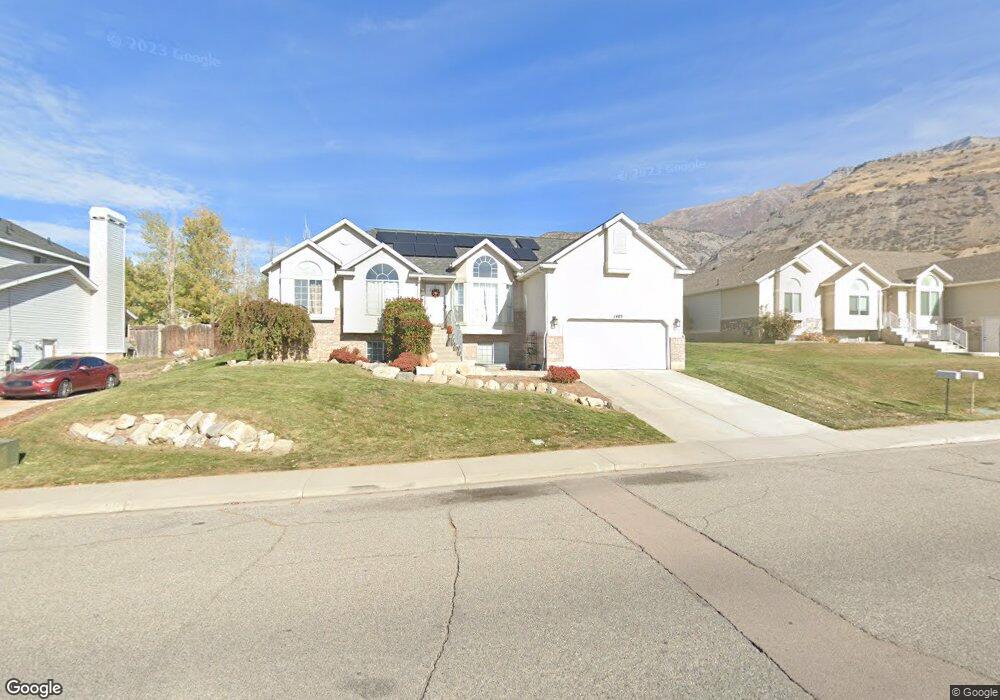
1403 E 1000 S Pleasant Grove, UT 84062
Estimated Value: $719,000 - $831,000
7
Beds
4
Baths
3,820
Sq Ft
$199/Sq Ft
Est. Value
About This Home
This home is located at 1403 E 1000 S, Pleasant Grove, UT 84062 and is currently estimated at $758,716, approximately $198 per square foot. 1403 E 1000 S is a home located in Utah County with nearby schools including Central Elementary School, Oak Canyon Junior High School, and Pleasant Grove High School.
Ownership History
Date
Name
Owned For
Owner Type
Purchase Details
Closed on
Jun 3, 2021
Sold by
Everingham Bruce and Everingham Laura
Bought by
Nisson Thomas L and Nisson Mckinzi M
Current Estimated Value
Home Financials for this Owner
Home Financials are based on the most recent Mortgage that was taken out on this home.
Original Mortgage
$344,988
Outstanding Balance
$312,344
Interest Rate
2.9%
Mortgage Type
New Conventional
Estimated Equity
$446,372
Purchase Details
Closed on
Aug 7, 2006
Sold by
Oneill Dale Patrick and Oneill Kathlyn Lorrie
Bought by
Everingham Bruce and Everingham Laura
Home Financials for this Owner
Home Financials are based on the most recent Mortgage that was taken out on this home.
Original Mortgage
$264,400
Interest Rate
6.69%
Mortgage Type
Balloon
Create a Home Valuation Report for This Property
The Home Valuation Report is an in-depth analysis detailing your home's value as well as a comparison with similar homes in the area
Home Values in the Area
Average Home Value in this Area
Purchase History
| Date | Buyer | Sale Price | Title Company |
|---|---|---|---|
| Nisson Thomas L | -- | Eagle Pointe Title Ins Agcy | |
| Everingham Bruce | -- | Eagle Pointe Title Insuranc |
Source: Public Records
Mortgage History
| Date | Status | Borrower | Loan Amount |
|---|---|---|---|
| Open | Nisson Thomas L | $344,988 | |
| Previous Owner | Everingham Bruce | $264,400 |
Source: Public Records
Tax History
| Year | Tax Paid | Tax Assessment Tax Assessment Total Assessment is a certain percentage of the fair market value that is determined by local assessors to be the total taxable value of land and additions on the property. | Land | Improvement |
|---|---|---|---|---|
| 2025 | $3,049 | $392,150 | -- | -- |
| 2024 | $3,049 | $363,990 | $0 | $0 |
| 2023 | $3,017 | $368,555 | $0 | $0 |
| 2022 | $2,875 | $349,470 | $0 | $0 |
| 2021 | $2,488 | $460,500 | $162,100 | $298,400 |
| 2020 | $2,279 | $413,500 | $144,700 | $268,800 |
| 2019 | $2,161 | $405,500 | $136,700 | $268,800 |
| 2018 | $2,132 | $378,300 | $128,600 | $249,700 |
| 2017 | $2,012 | $190,080 | $0 | $0 |
| 2016 | $1,997 | $182,160 | $0 | $0 |
| 2015 | $2,035 | $175,780 | $0 | $0 |
| 2014 | $2,055 | $175,780 | $0 | $0 |
Source: Public Records
Map
Nearby Homes
Your Personal Tour Guide
Ask me questions while you tour the home.